The Dispute Overview dashboard in Subotiz shows dispute performance for the selected time range, including dispute rate, number of disputes, and disputed amount. It supports filtering by payment provider and includes trend and distribution analysis to help merchants monitor dispute risk and identify anomalies.
Accessing the Dashboard
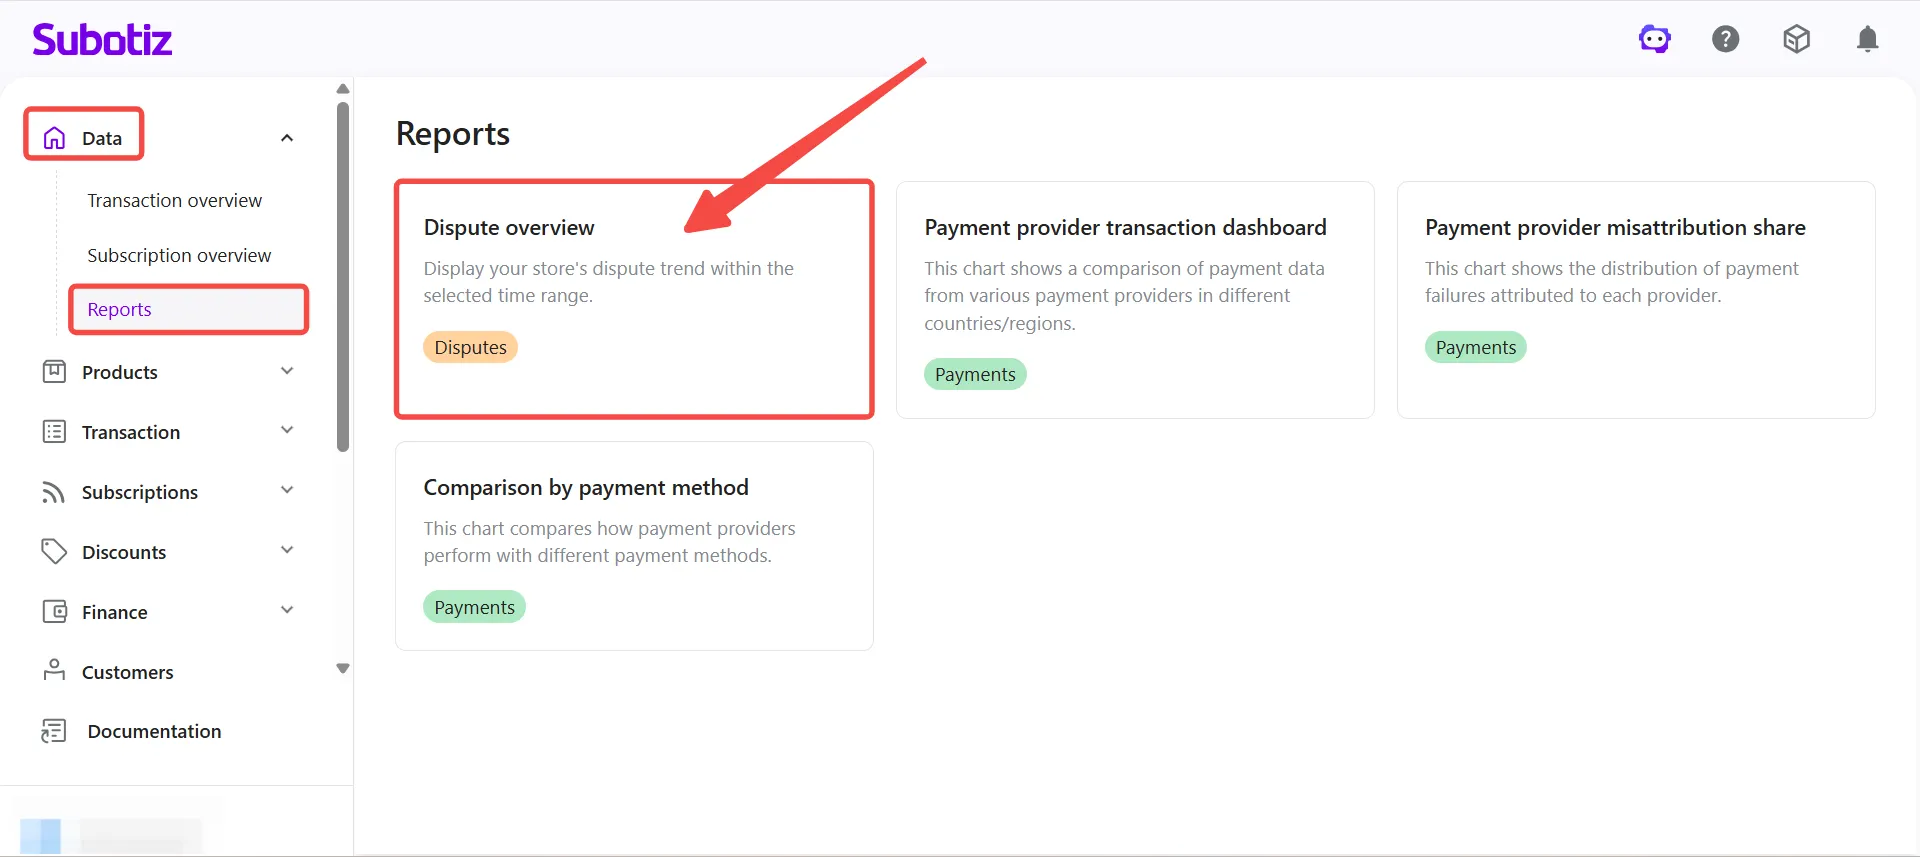
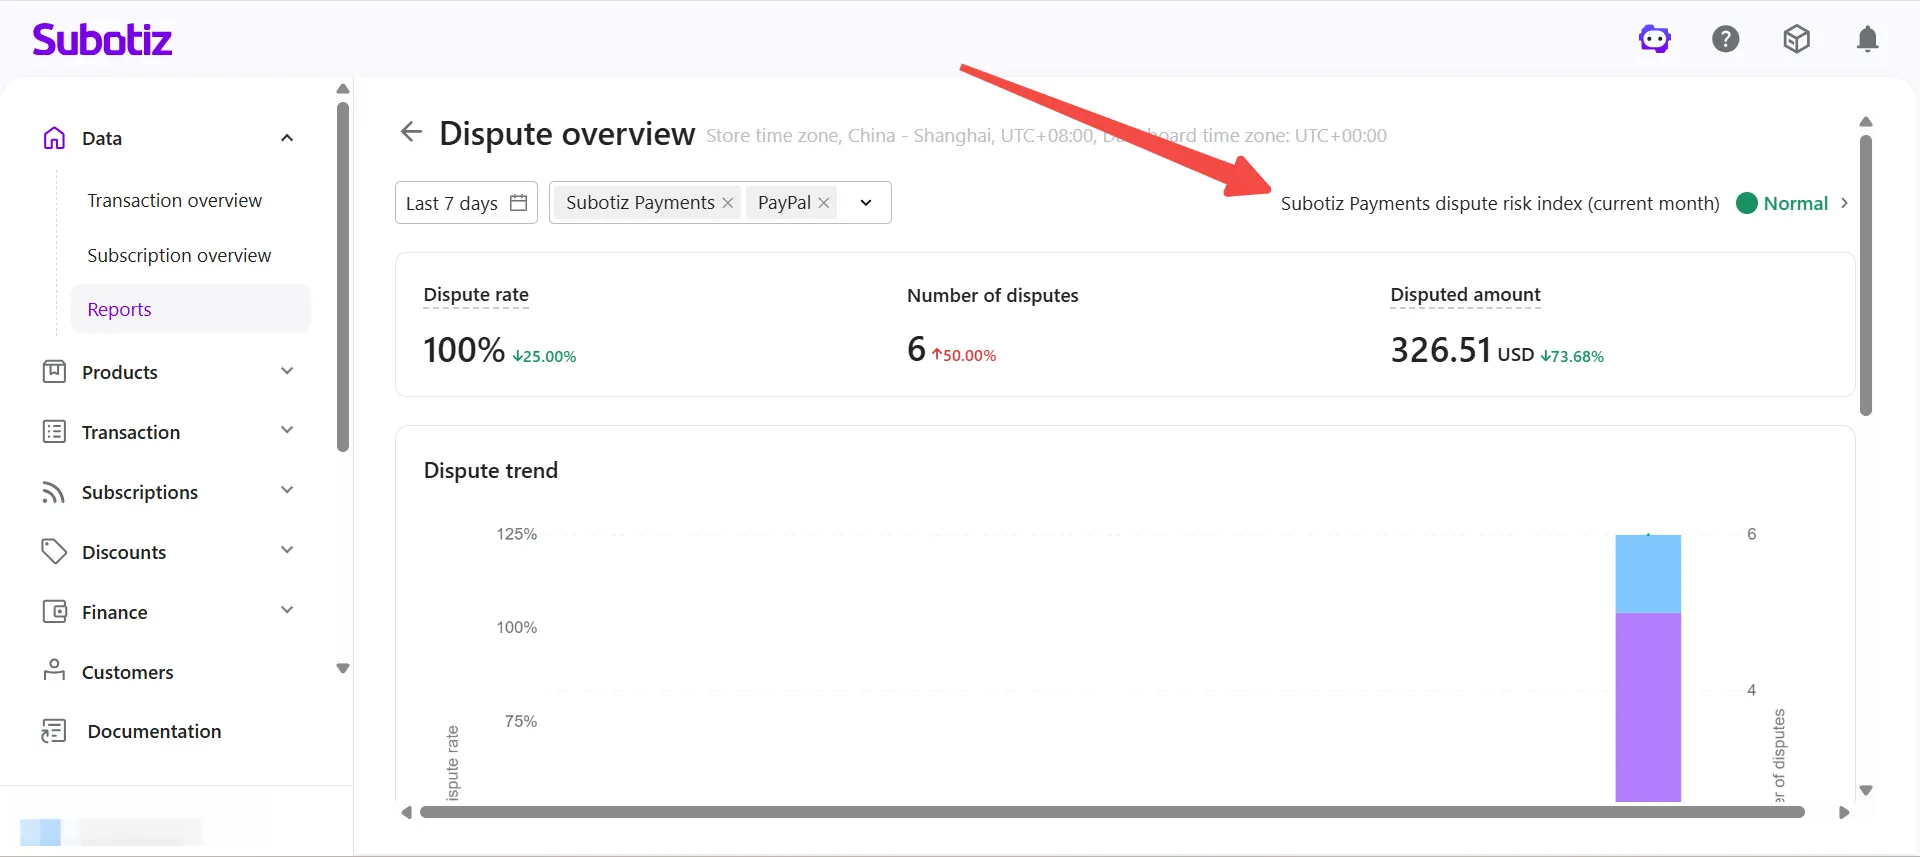
- Open the dashboard: In the Subotiz admin, go to Data > Reports and select Dispute overview.
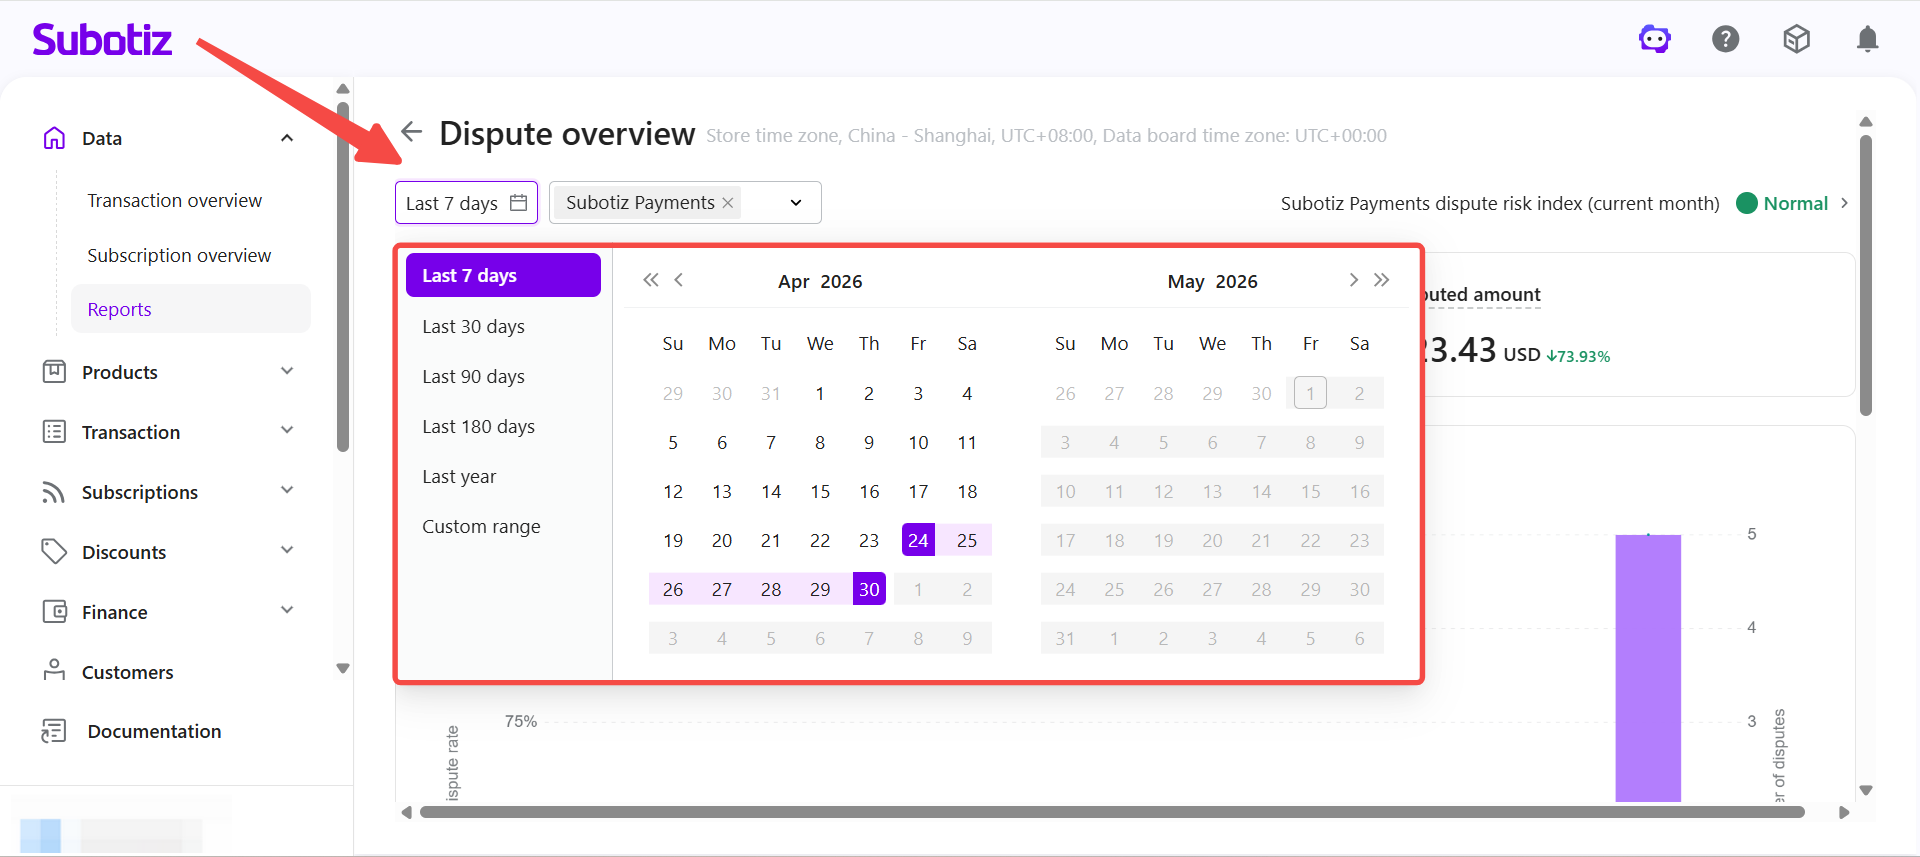
- Choose a time range: Use the selector in the upper-left corner to select a period: Last 7 days, Last 30 days, Last 90 days, Last 180 days, Last year, or Custom range. All metrics and charts update based on the selected range.
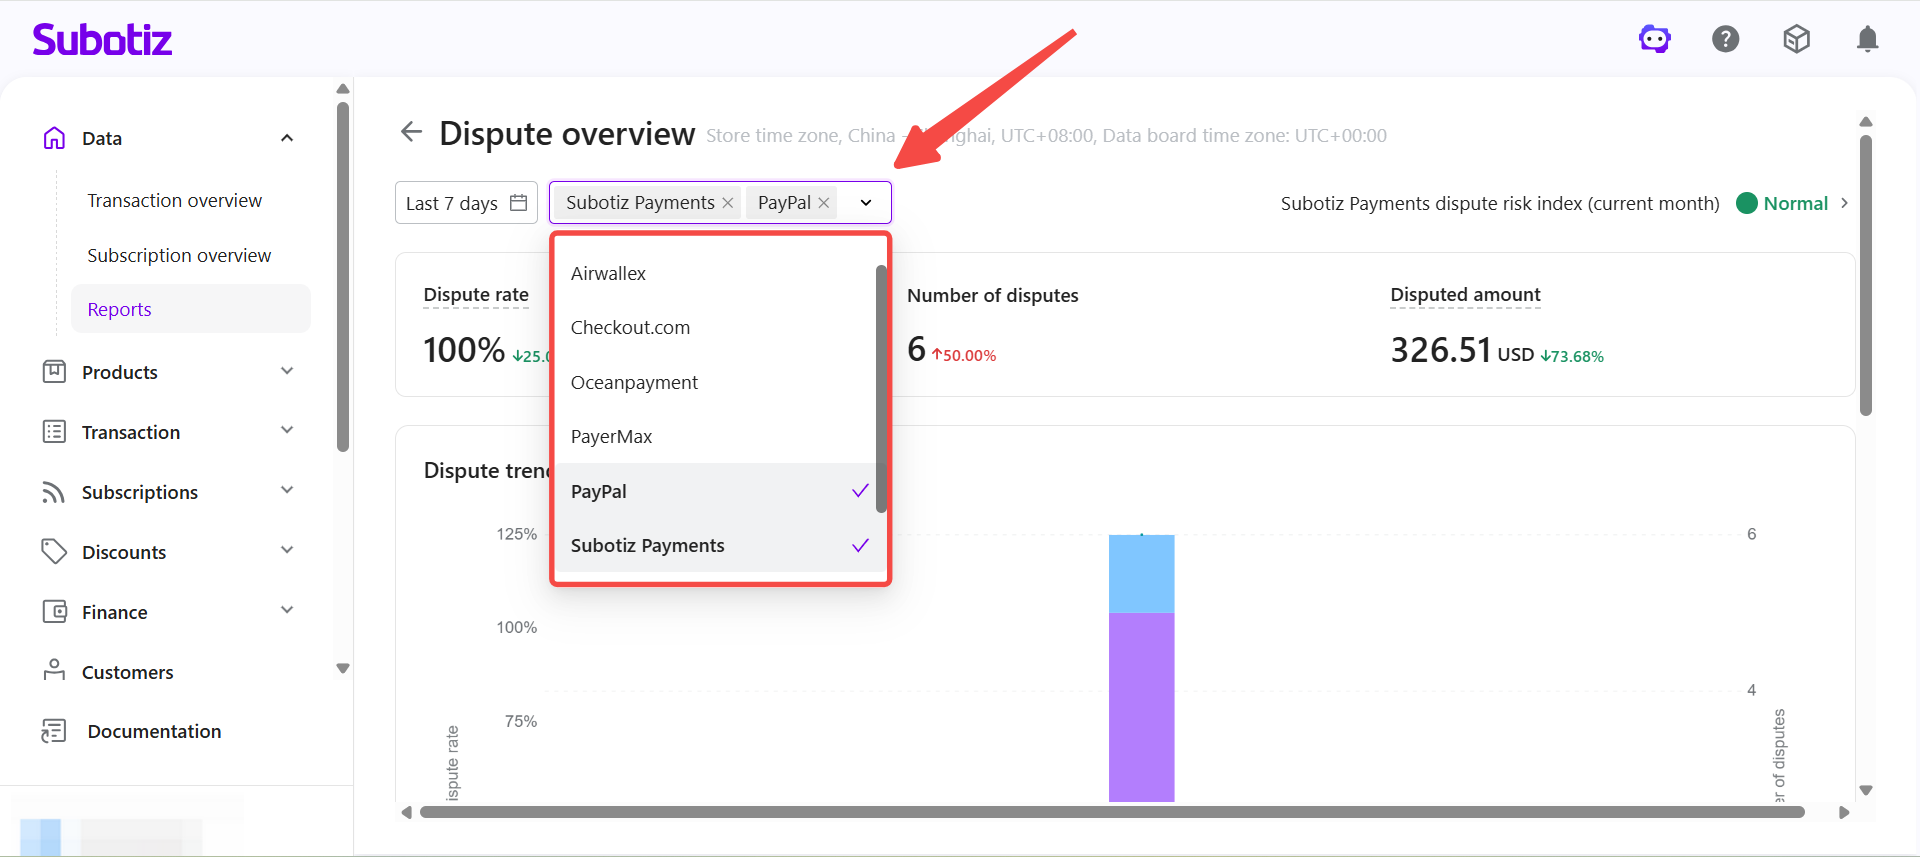
- Filter by payment provider: Use the dropdown to select one or more payment providers. The page updates to show data for the selected providers. Multiple selections are supported for cross-provider comparison.
Viewing the Dispute Risk Index
The Subotiz Payments dispute risk index (current month) is displayed in the top-right corner of the dashboard. This indicator reflects Subotiz Payments data for the current month only and does not change based on the selected time range or payment provider filter.
- Calculation: Current month dispute orders ÷ Current month successful orders × 100%
- Normal (green): Dispute rate ≤ 0.8%
- Monitor (yellow): 0.8% < Dispute rate < 1.0%
- Risk (red): Dispute rate ≥ 1.0%
- No successful orders, no disputes: Displays Normal (green)
- No successful orders, disputes present: Displays Risk (red)
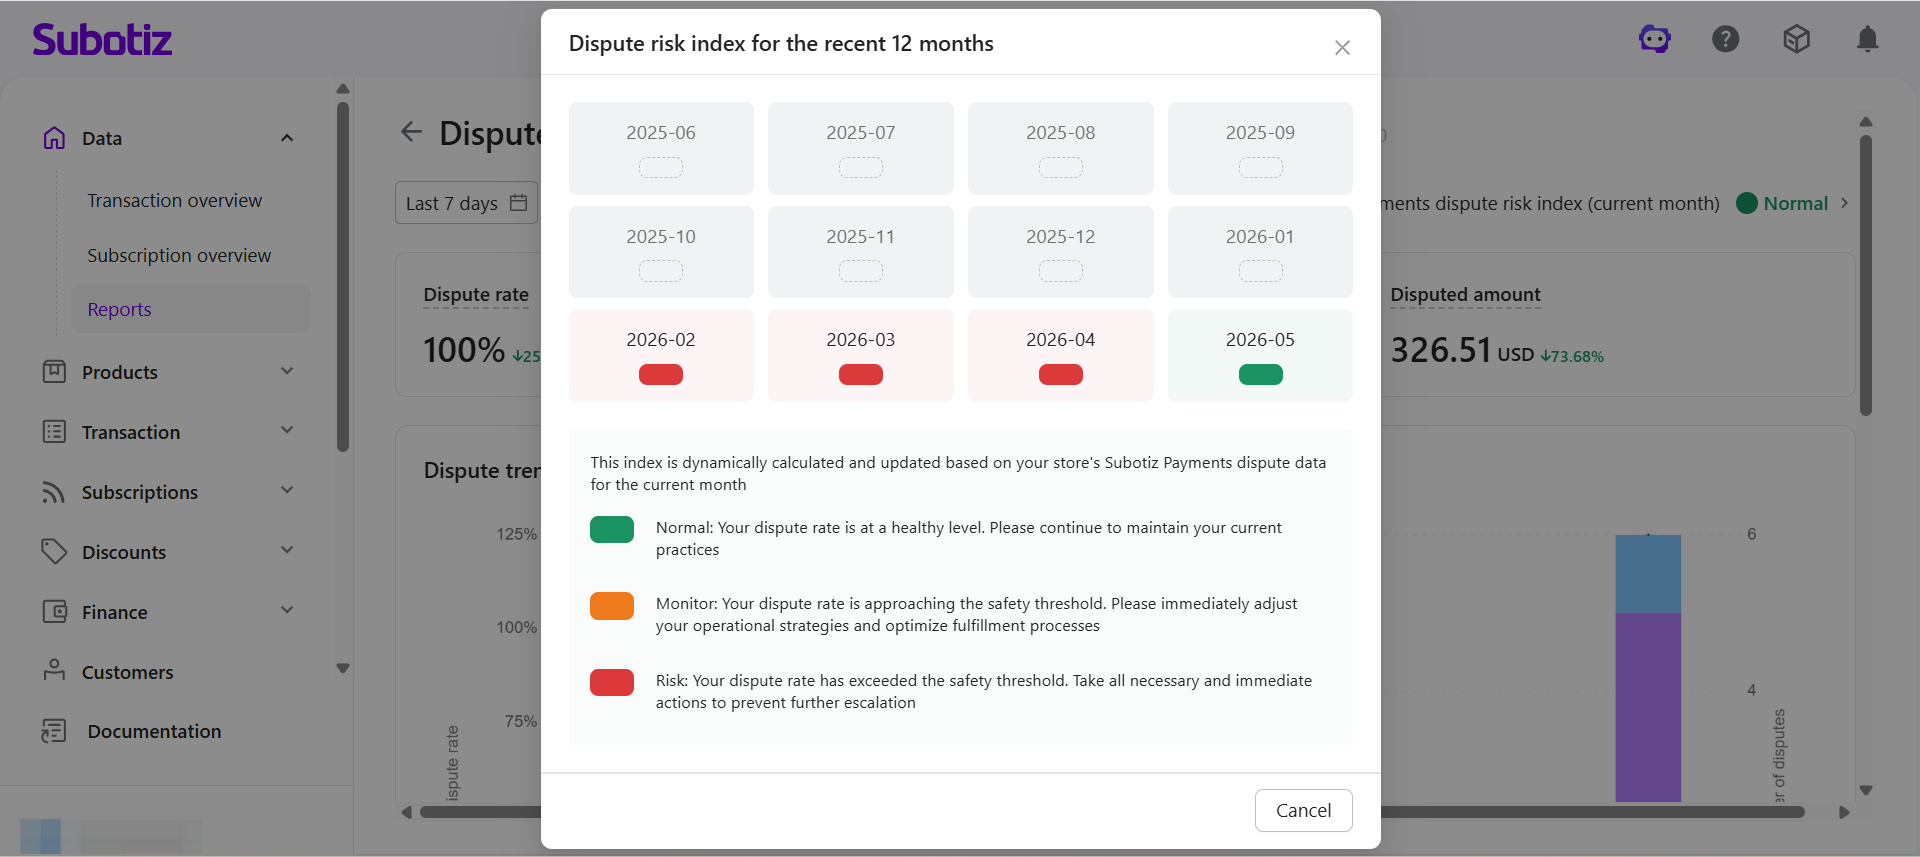
Click the dispute risk index to open a popup showing the risk status for each of the past 12 months. The popup also shows guidance for each status.
- Normal: Dispute rate remains within a healthy range.
- Monitor: Dispute rate is approaching the threshold and should be reviewed closely.
- Risk: Dispute rate has exceeded the threshold and requires immediate attention.
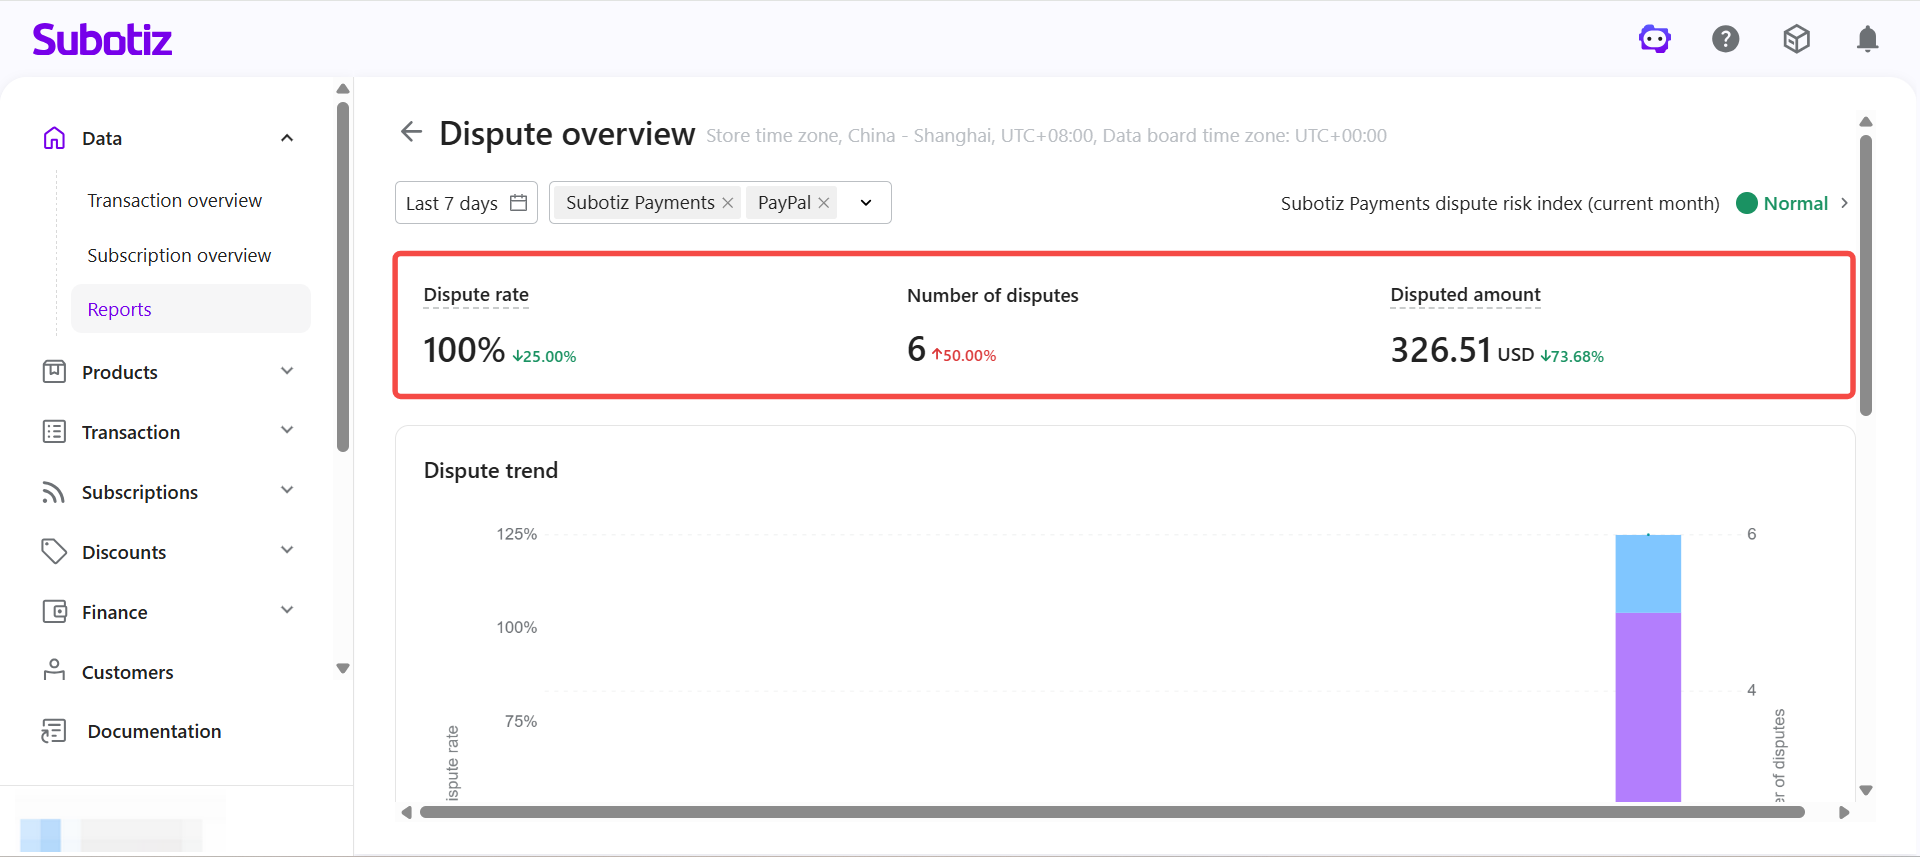
Viewing Key Metrics
The top section summarizes dispute data for the selected period.
- Dispute rate: Calculated as number of disputes ÷ number of successful orders, reflecting the proportion of disputed orders against total successful orders.
- Number of disputes: Total disputes generated during the selected period.
- Disputed amount: Total transaction amount related to disputes during the selected period. Amounts are uniformly converted into USD for accumulation and displayed for reference only.
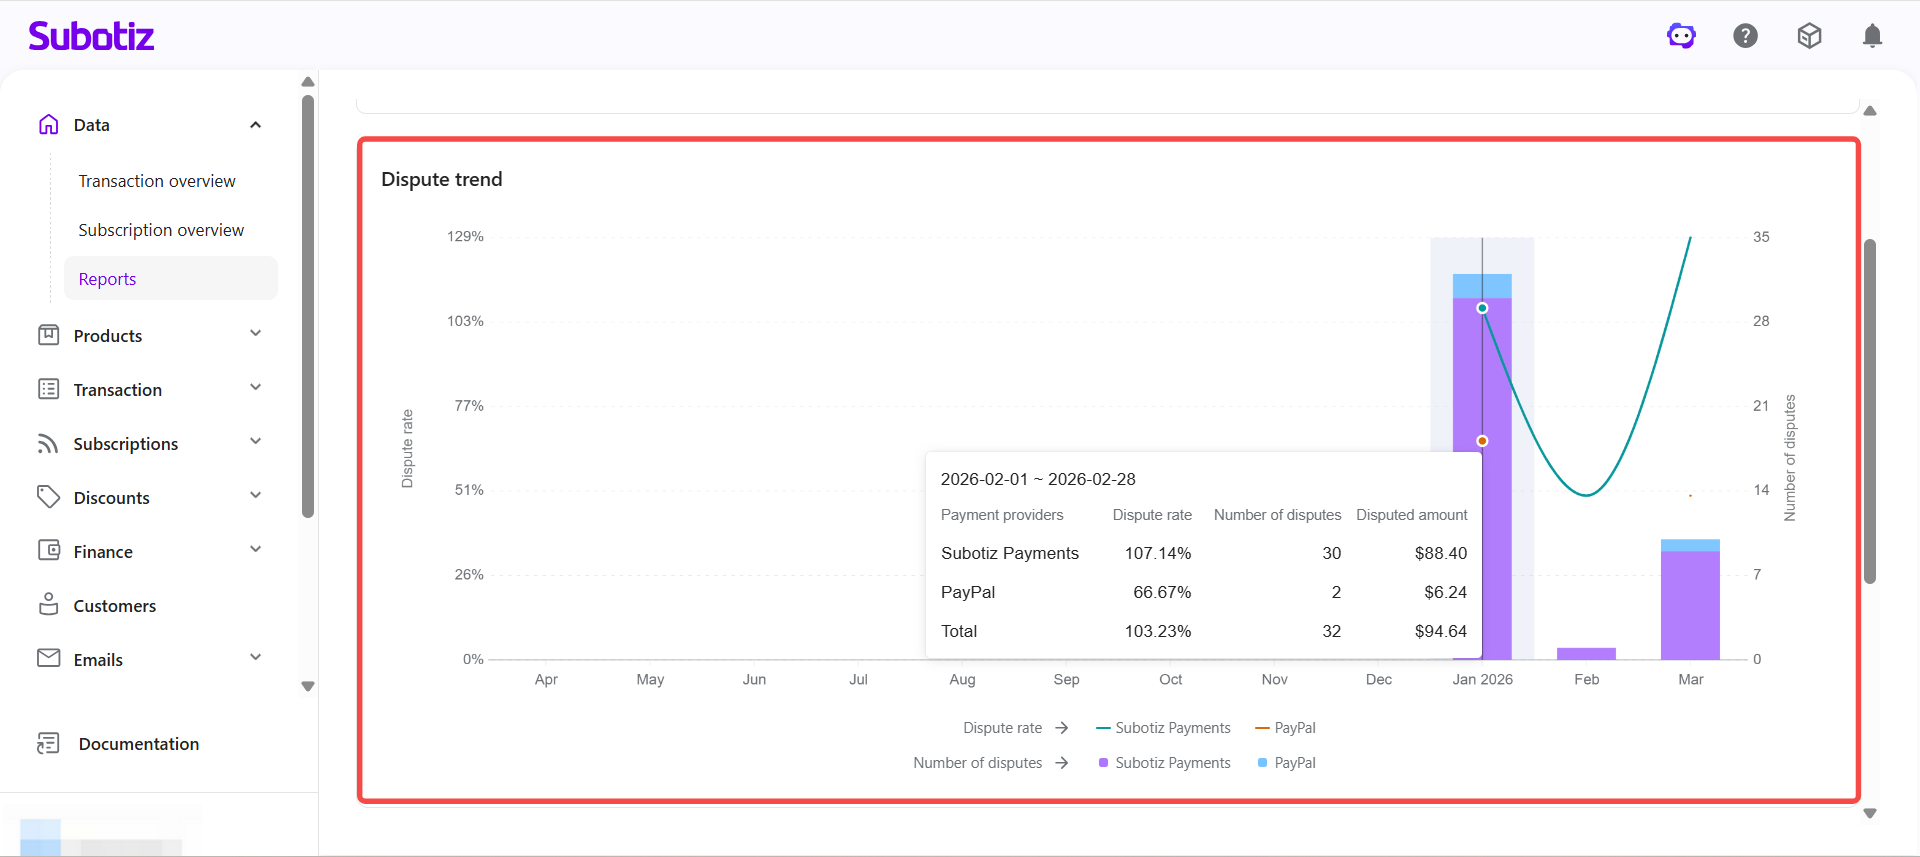
Analyzing the Dispute Trend
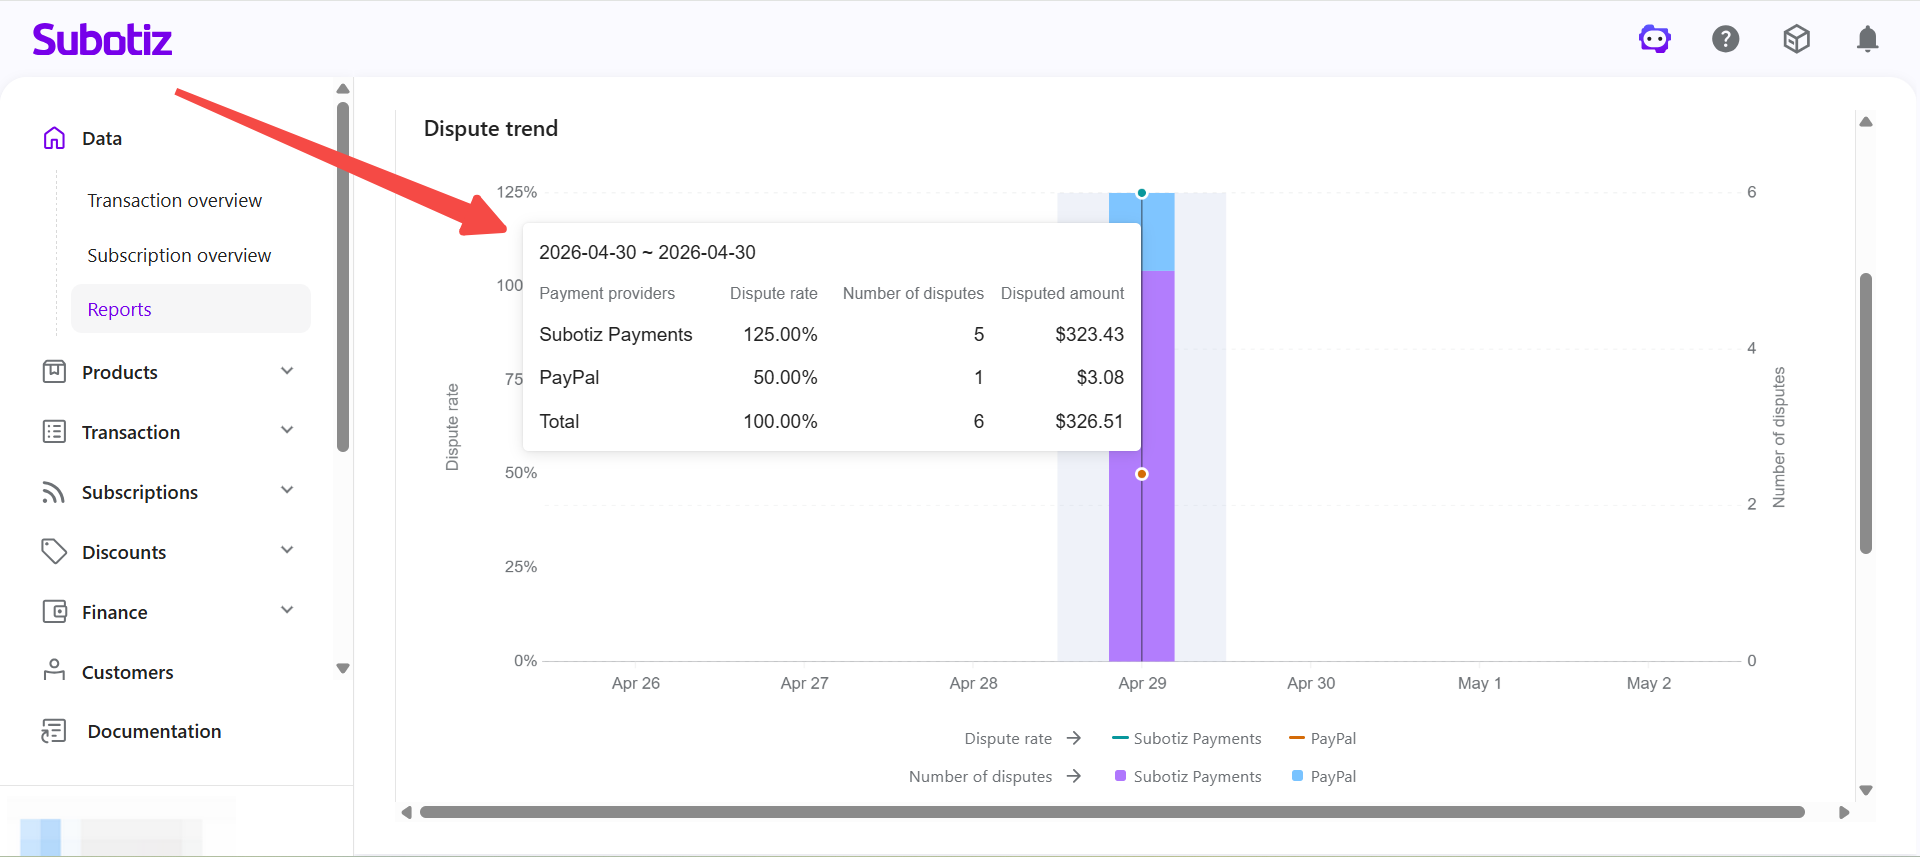
The Dispute trend chart shows how dispute rate and dispute volume change over time.
- Line: Dispute rate trend.
- Bars: Number of disputes over time.
Hover over any interval to view the payment provider, dispute rate, number of disputes, and disputed amount for that period.
When interpreting trend data, consider the following:
- Dispute rate rises sharply in a short period: Usually indicates recent order anomalies that require immediate investigation.
- Dispute count increases but amount stays low: Typically involves small-value disputes. A significant rise in disputed amount may indicate high-value order risk.
- Sustained upward trend: Often signals a systemic issue. A single spike is more likely an isolated incident.
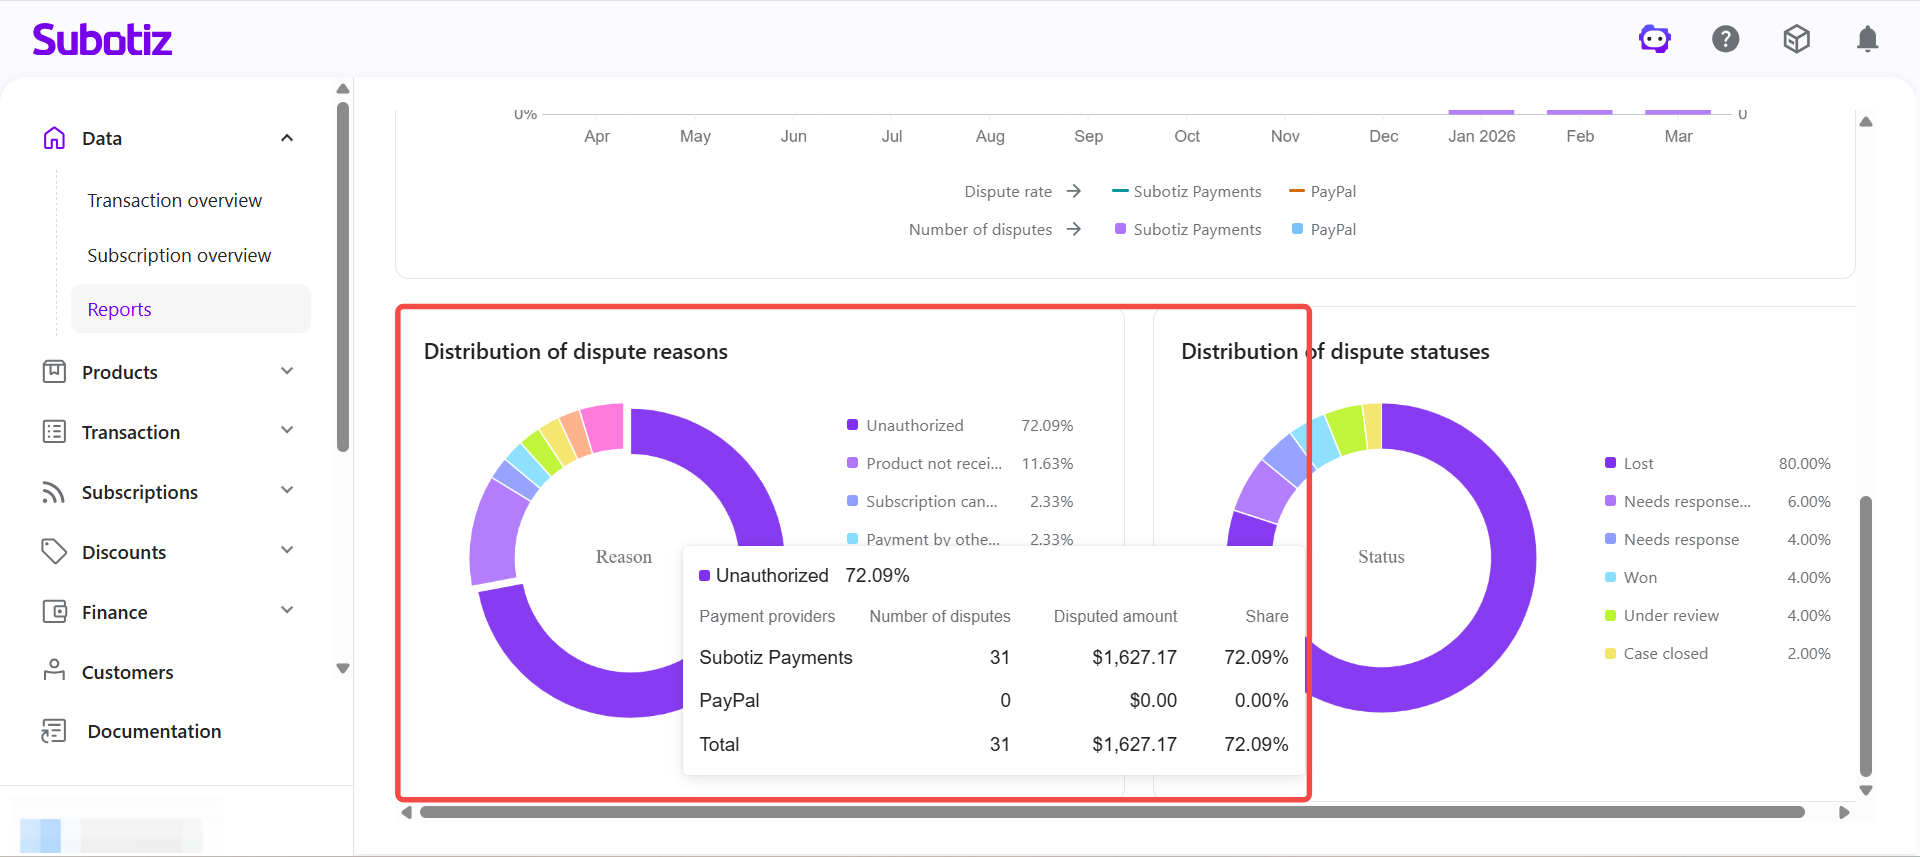
Analyzing Dispute Reason Distribution
The donut chart on the lower left shows the breakdown of dispute reasons across all disputes, including the percentage share, number of disputes, and disputed amount for each reason. Common categories include unauthorized transactions, product not received, and product not as described. Use this chart to identify high-frequency dispute types and target improvements in order management, fulfillment, or post-sale processes.
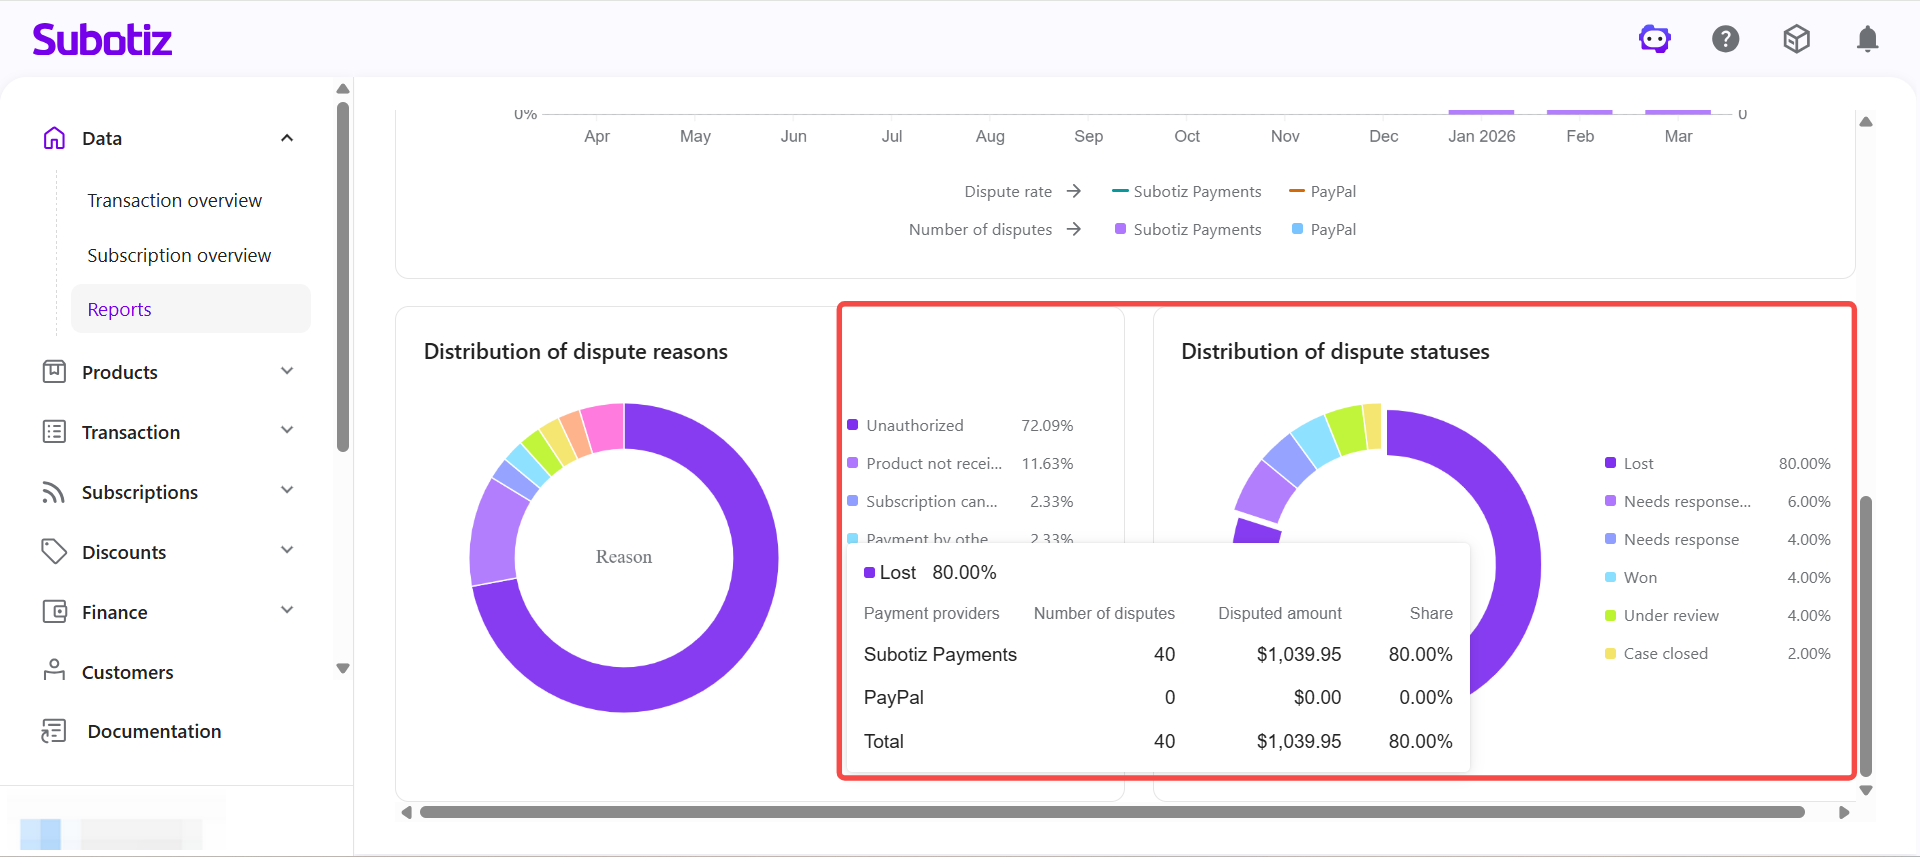
Analyzing Dispute Status Distribution
The donut chart on the lower right shows how disputes are distributed across processing stages, including Lost, Won, and Under review. Use this view to assess the current dispute handling structure and track overall case progress.
Understanding the Data
When reviewing the dashboard, consider the following patterns:
- Sustained increase in dispute rate: Prioritize reviewing recent orders, payment flows, or customer complaints.
- One reason category is significantly higher than others: Typically indicates a concentrated issue in that area requiring targeted action.
- High proportion of Under review cases: Indicates a backlog of unresolved disputes that need follow-up.
- One provider has a notably higher dispute rate: Check that provider's transaction quality and fraud control settings.
Best Practices
- Monitor dispute rate trends regularly: Identify unusual spikes and respond promptly.
- Track the dispute risk index: When the index shows Monitor or Risk, prioritize investigating current-month disputes.
- Analyze high-frequency dispute reasons: Address concentrated issues through improvements to orders, product descriptions, fulfillment, or post-sale support.
- Compare across payment providers: Identify high-risk channels and adjust strategy accordingly.
- Review anomalous periods: Use trend, reason, and status data together to assess root causes and refine resolution plans.
The Dispute Overview dashboard helps merchants track dispute activity, identify emerging risk patterns, and make informed decisions based on dispute rate, volume, amount, and distribution insights.