The Comparison by Payment Method report in Subotiz Reports provides consolidated performance analysis across supported payment methods, including Card, Apple Pay, Google Pay, PayPal, BNPL, and LPM (Local Payment Methods). The report supports authorization rate analysis across different payment channels.
The report enables merchants to evaluate:
- Authorization performance by payment method
- Order volume trends
- Total transaction contribution
- Performance variations across different payment providers
By analyzing performance across payment methods, merchants can optimize checkout configuration and improve overall revenue stability.
Accessing the Comparison by Payment Method Report
- Navigate to the Reports module: Go to Data > Reports in Subotiz Admin.
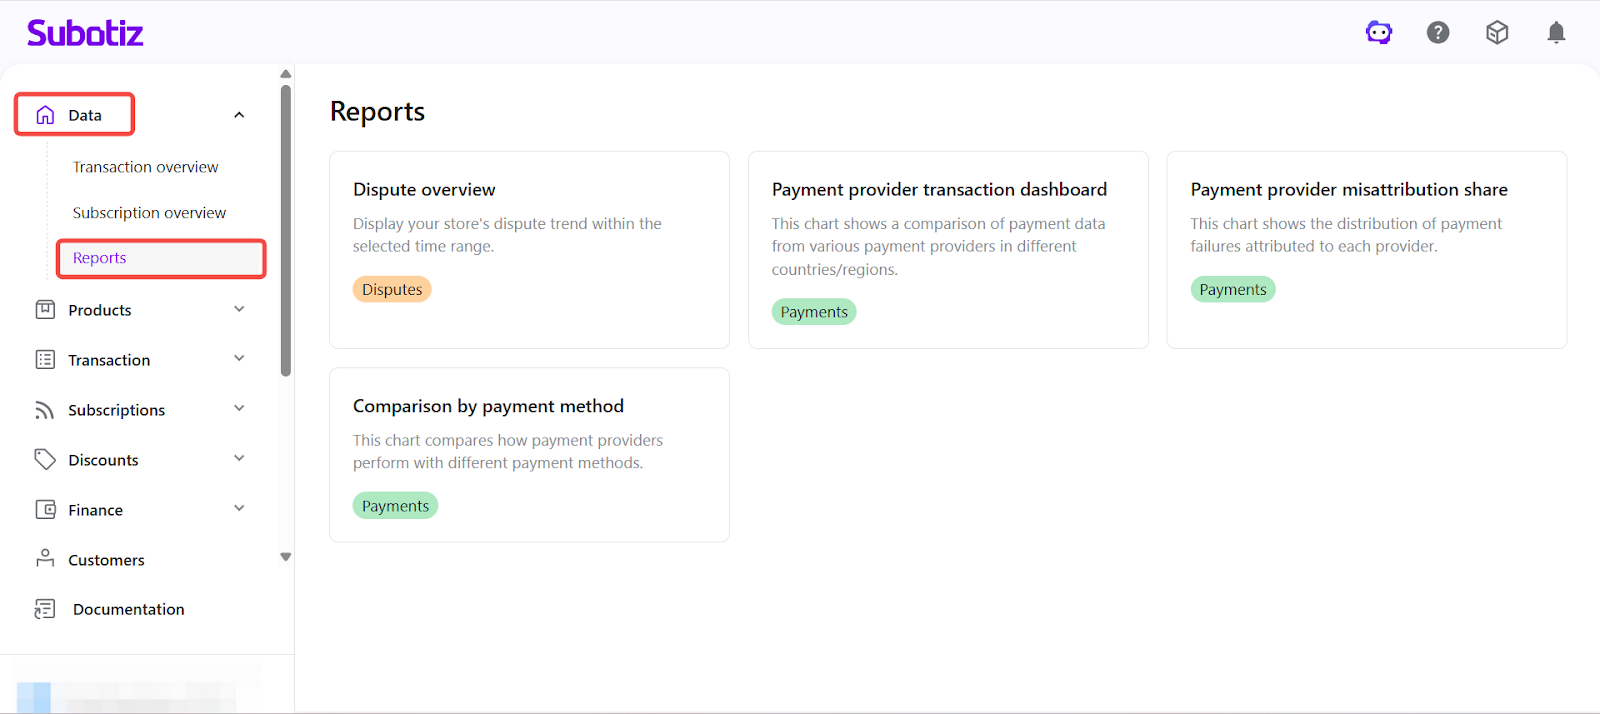
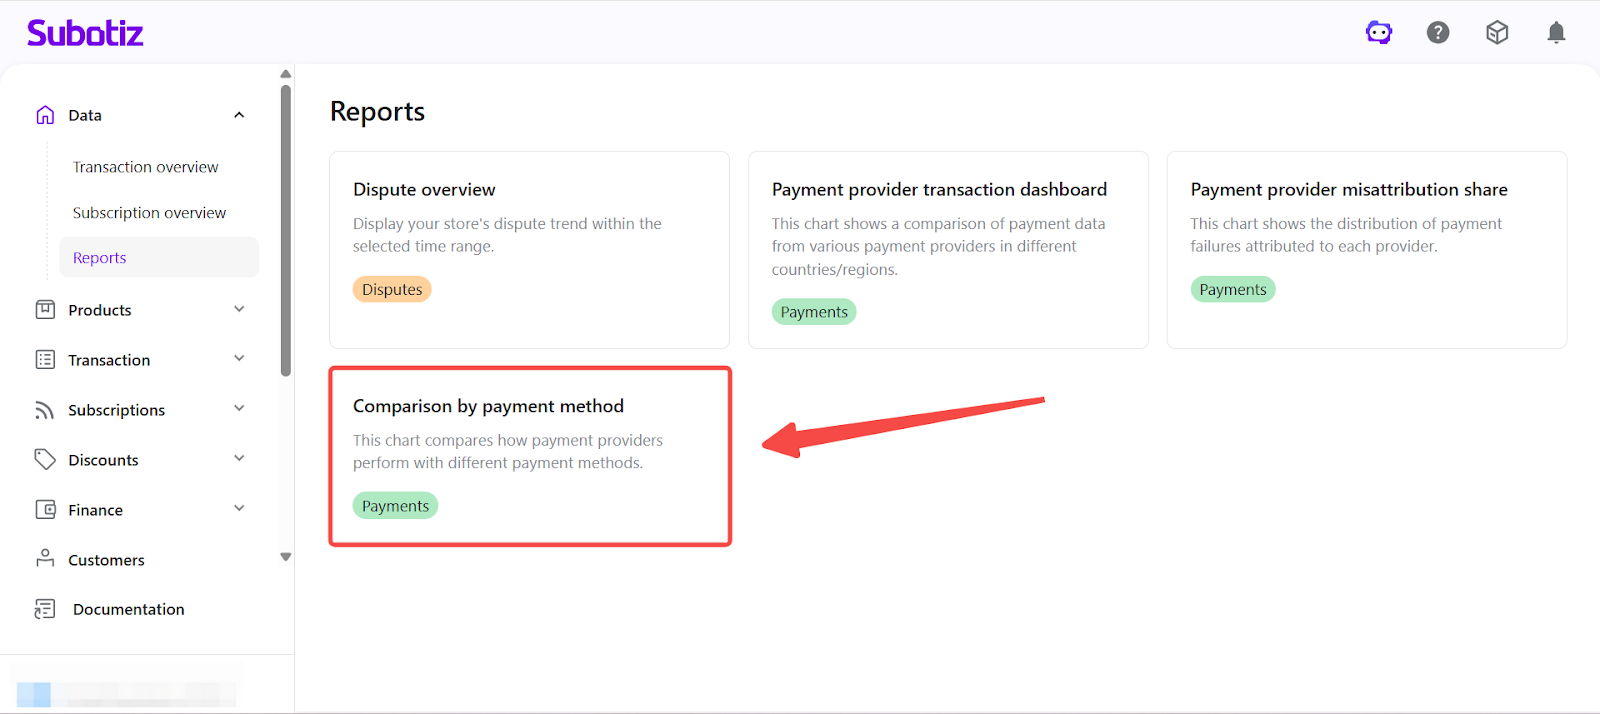
- Open the report: Click Comparison by payment method to enter the analytics page.
Configuring Filters
- Select Time Range: Click the All time selector in the upper-left corner and choose a predefined range such as:
- Today
- Yesterday
- This week
- This month
- This year
- Last 7 days
- Last 30 days
- Custom range
All metrics and charts update dynamically based on the selected time range.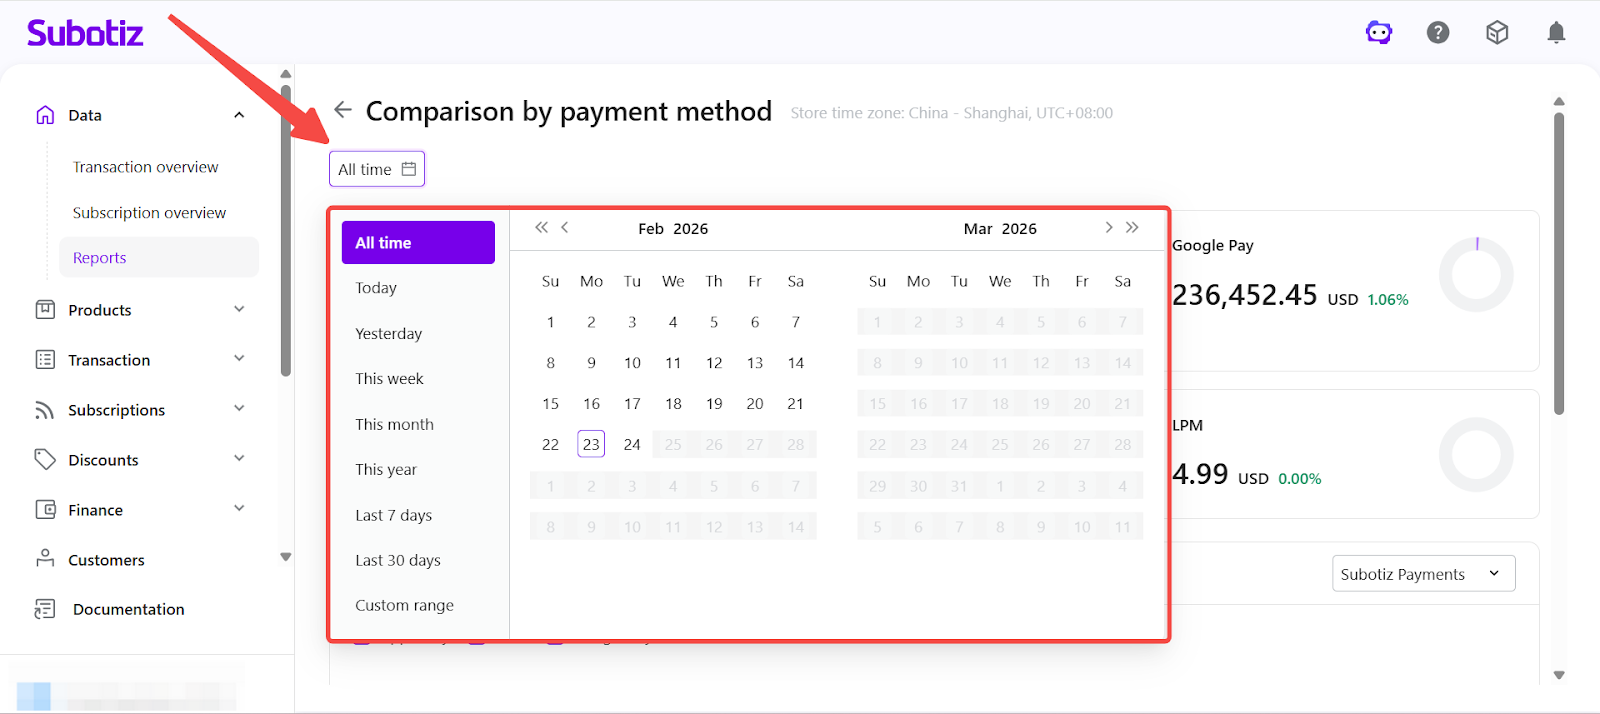
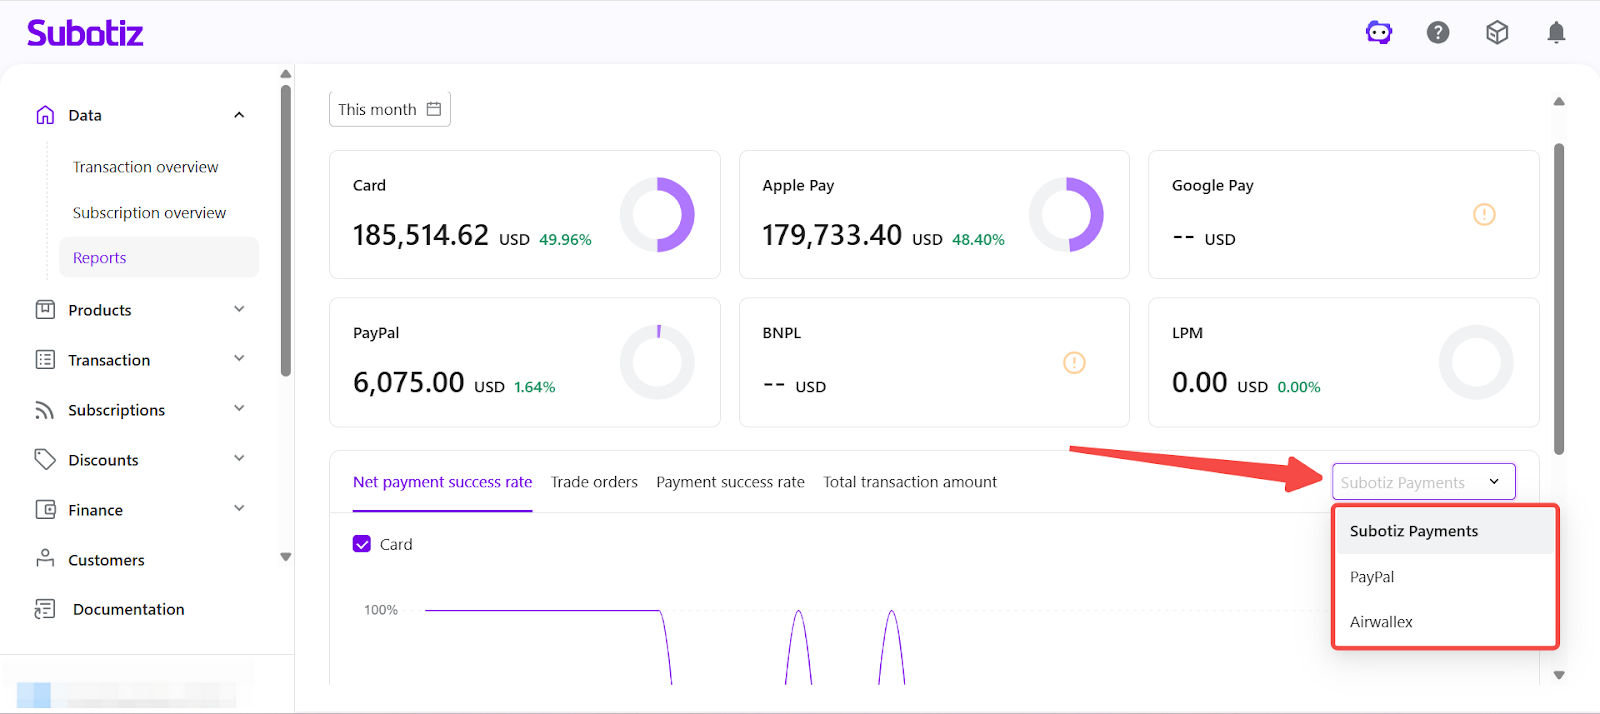
- Select Payment Provider: Use the provider dropdown in the upper-right corner to switch between available payment providers. The provider list is dynamically generated based on the merchant’s configured and active payment providers. Only providers that are enabled and have transaction data within the selected time range will be displayed. Switching providers allows merchants to compare payment method performance under different providers.
- Select Payment Methods: Use the checkbox selector above the chart to include or exclude specific payment methods.
- The selected payment provider
- The merchant’s configured payment methods
- Transaction data within the selected time range
This allows merchants to isolate individual payment method performance or compare multiple methods simultaneously.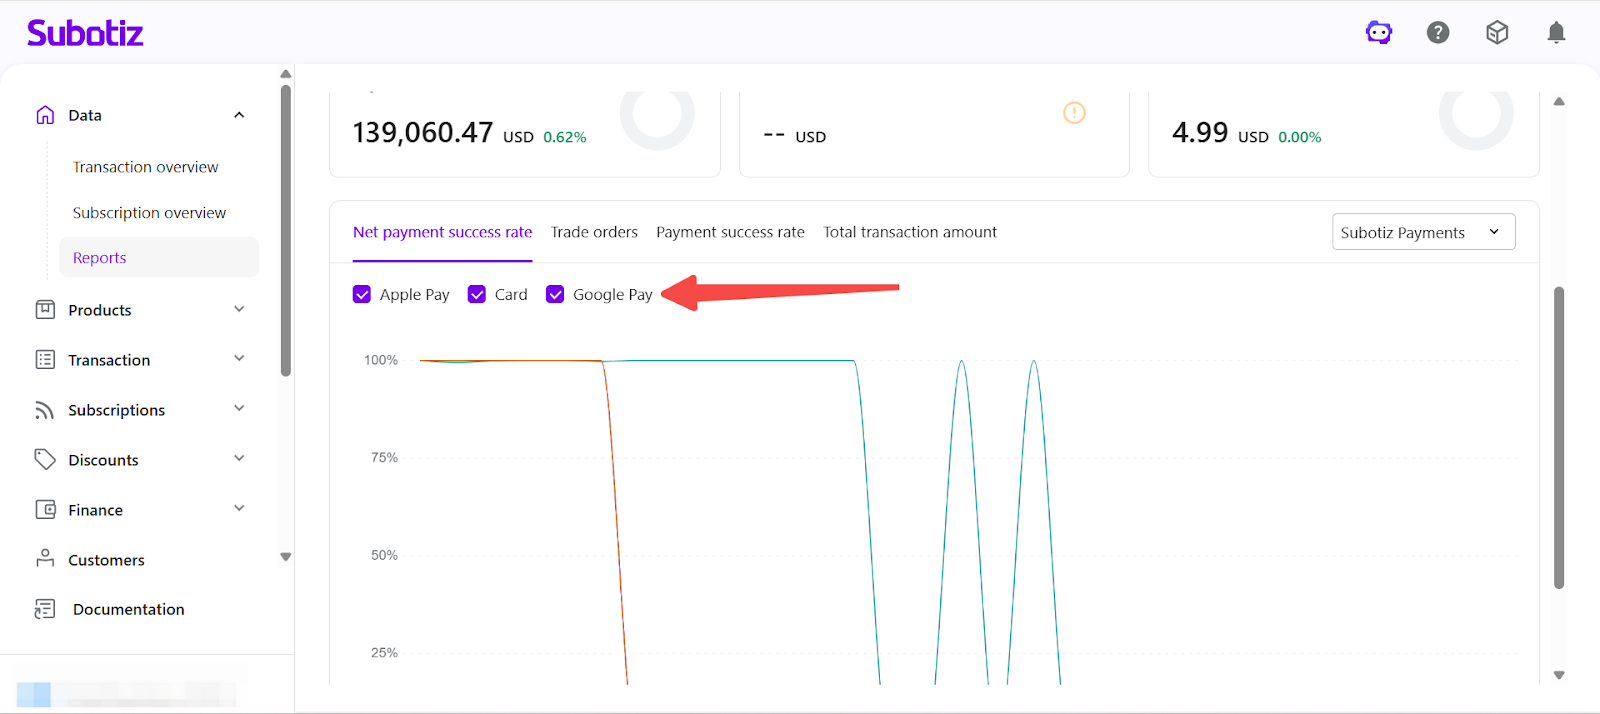
Understanding the Dashboard
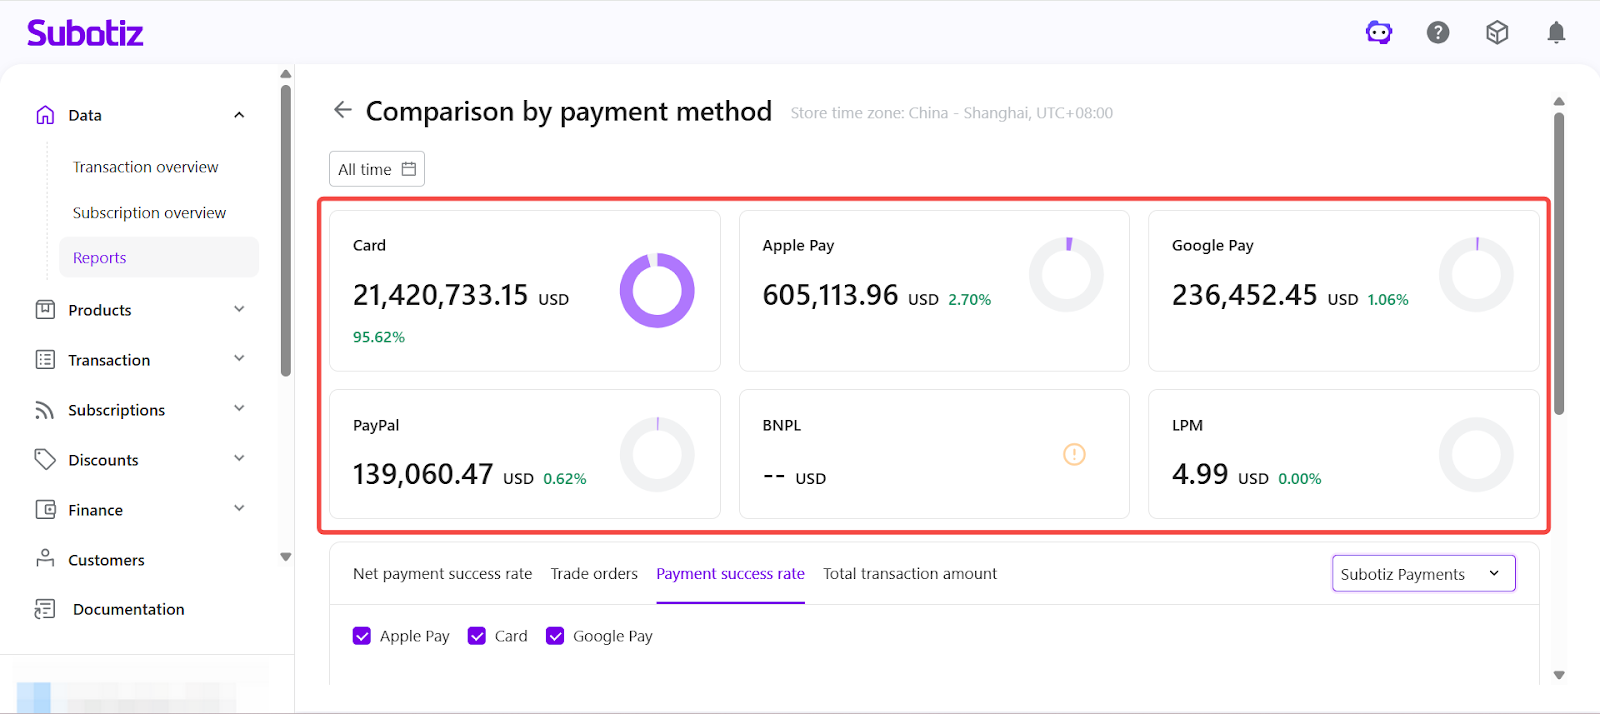
The payment method summary cards displayed at the top of the page provide an overview of transaction distribution within the selected time range.
- Each card displays:
- Total transaction amount
- Percentage share of total transactions
- These summary cards remain fixed and are not affected by changes to:
- Metric tabs (Net payment success rate, Trade orders, Payment success rate, Total transaction amount)
- Payment method checkboxes
- Payment provider selection
They update only when the selected time range is modified. The chart section below updates dynamically based on the selected metric tab, provider, and payment method filters.
Report Views
The report includes four performance views. Use the top navigation tabs to switch between metrics:
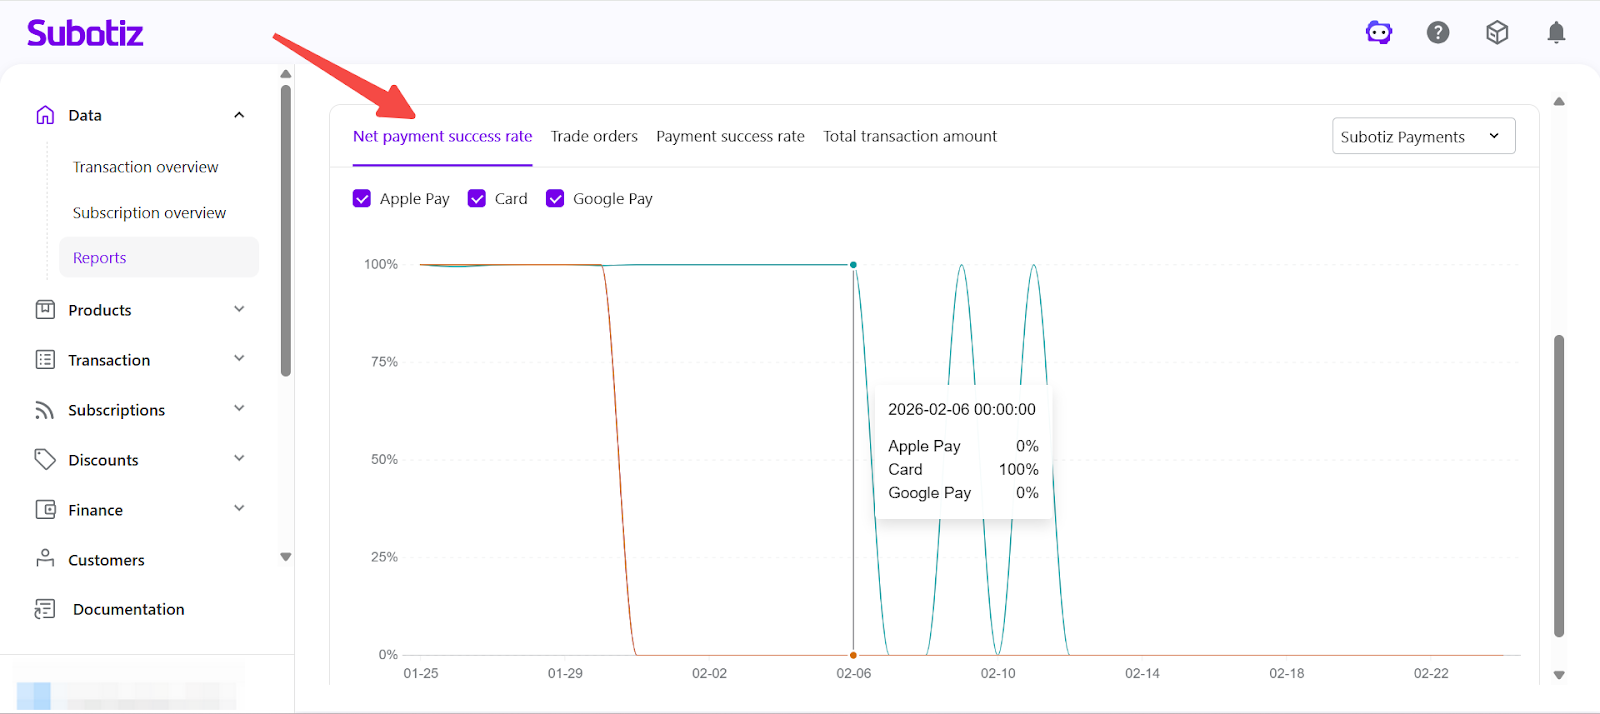
- Net Payment Success Rate: Displays the authorization success rate excluding customer-related failures.
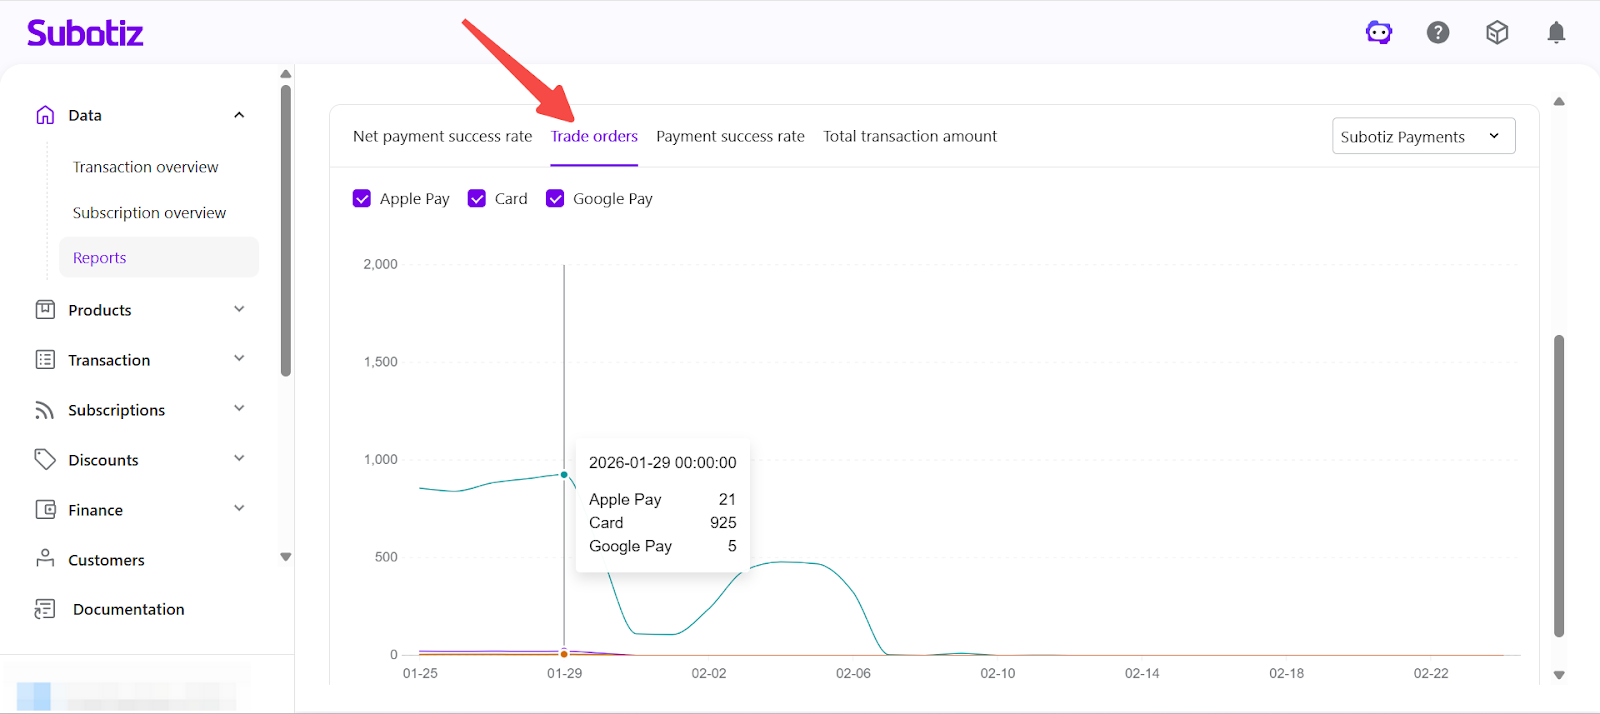
- Trade Orders: Shows the total number of trade orders processed by each payment method over time. This view helps identify usage trends and payment method adoption patterns.
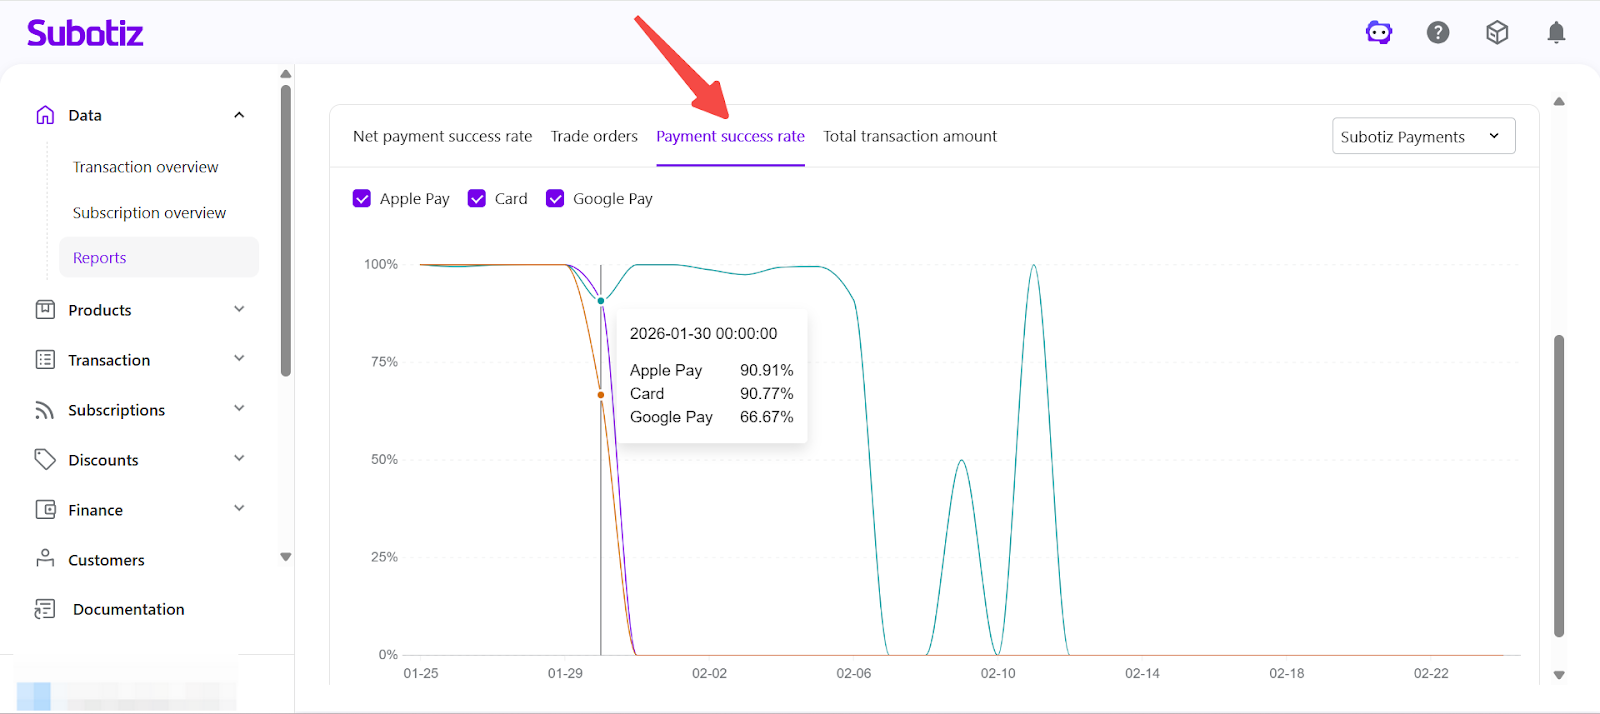
- Payment Success Rate: Displays overall authorization success rate, including all failure types. This provides a complete view of end-to-end payment performance.
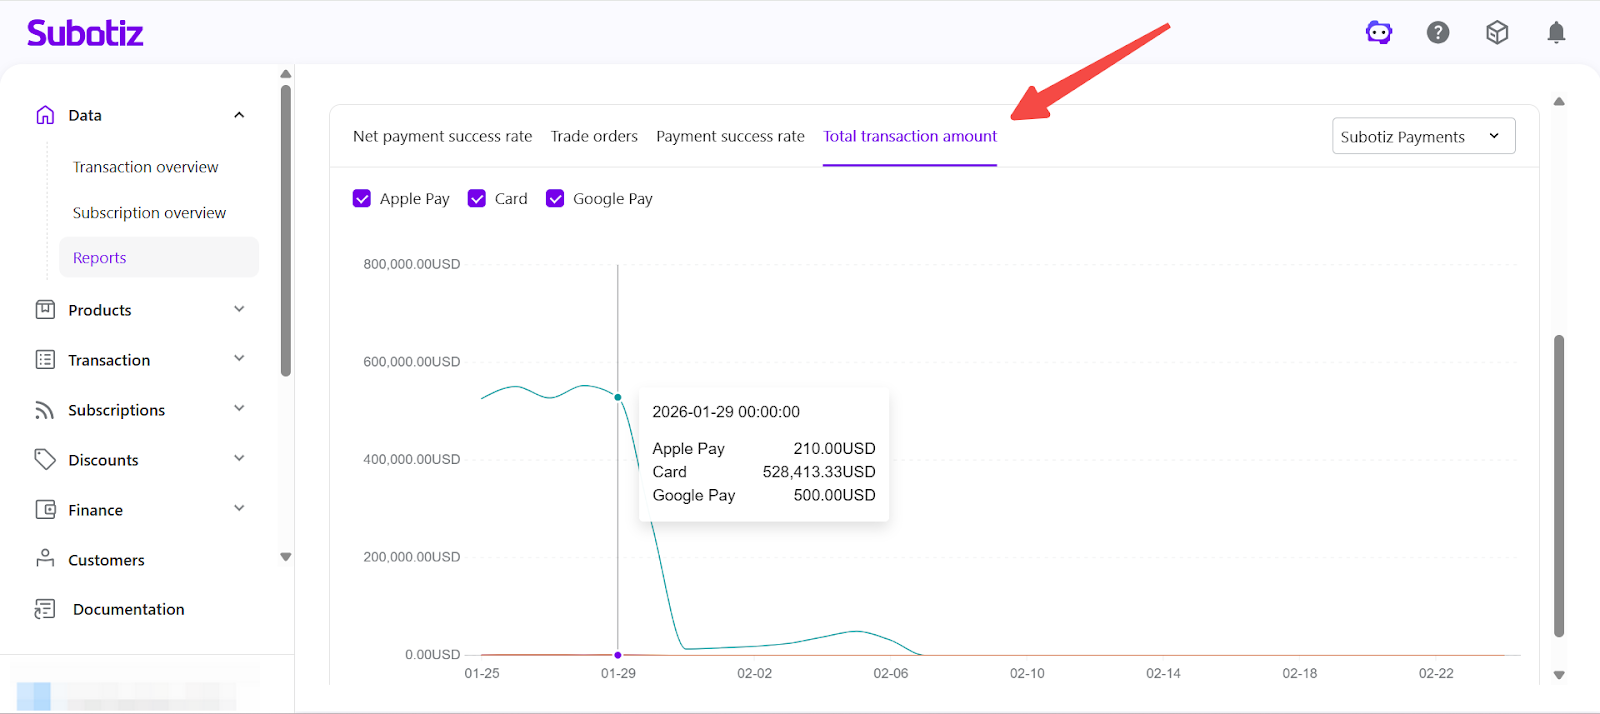
- Total Transaction Amount: Displays total processed transaction value by payment method. This helps evaluate revenue contribution and identify high-performing payment channels.
Best Practices
- Compare authorization rates across payment methods to identify performance differences.
- Monitor order volume fluctuations to detect adoption changes.
- Evaluate revenue contribution before enabling or disabling payment methods.
- Compare provider-level differences to optimize routing strategy.
The Comparison by payment method report provides a consolidated view of performance across payment methods and providers. By analyzing authorization rates, trade orders, and transaction amounts, merchants can optimize checkout configuration and improve overall revenue performance.