The Payment Provider Transaction Dashboard in Subotiz Reports enables merchants to monitor payment performance, payment success rates, and transaction volume across multiple providers and markets. It also supports payment routing optimization, improved authorization performance, and data-driven operational decisions.
Accessing the Payment Provider Transaction Dashboard
- Access the Reports module: Go to Data > Reports in Subotiz Admin.
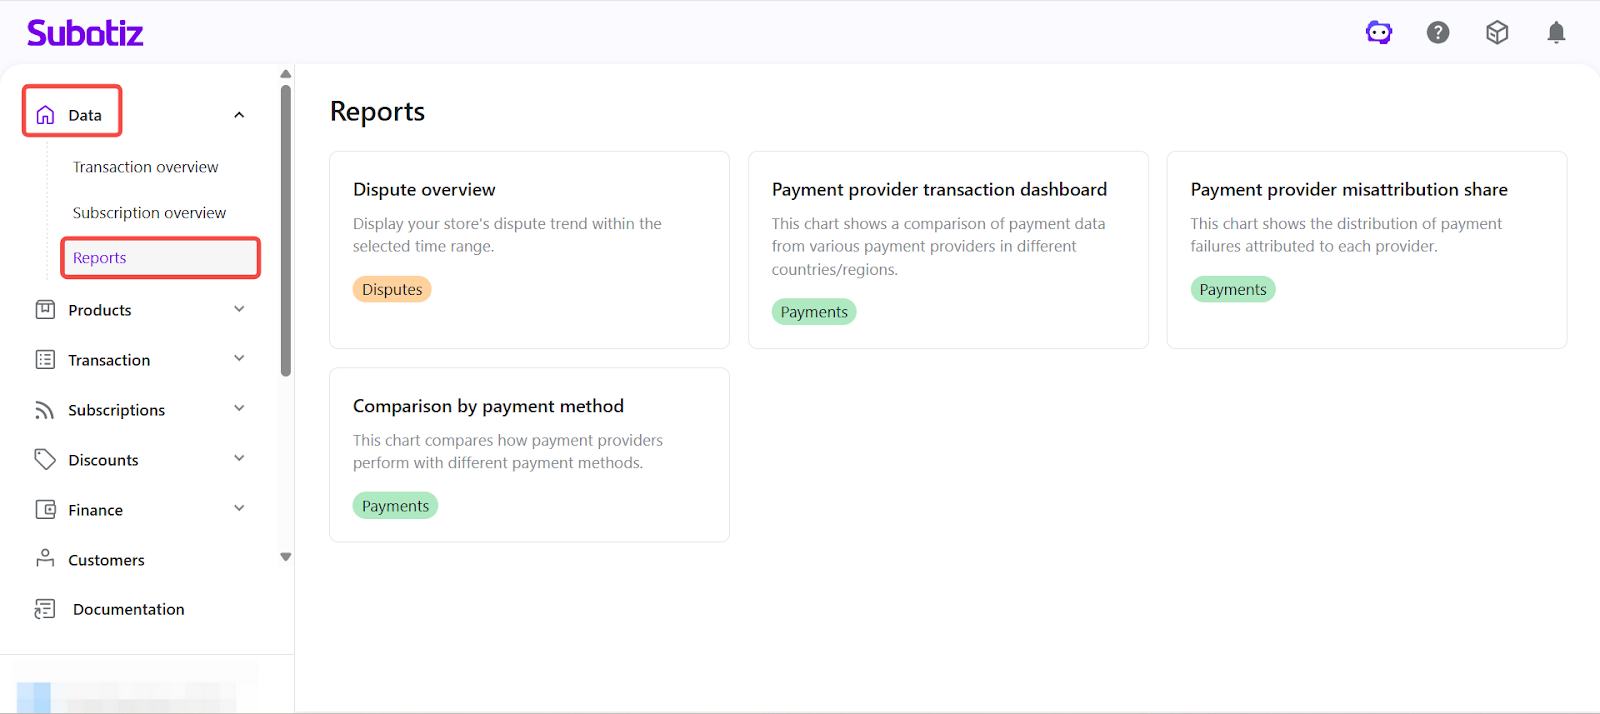
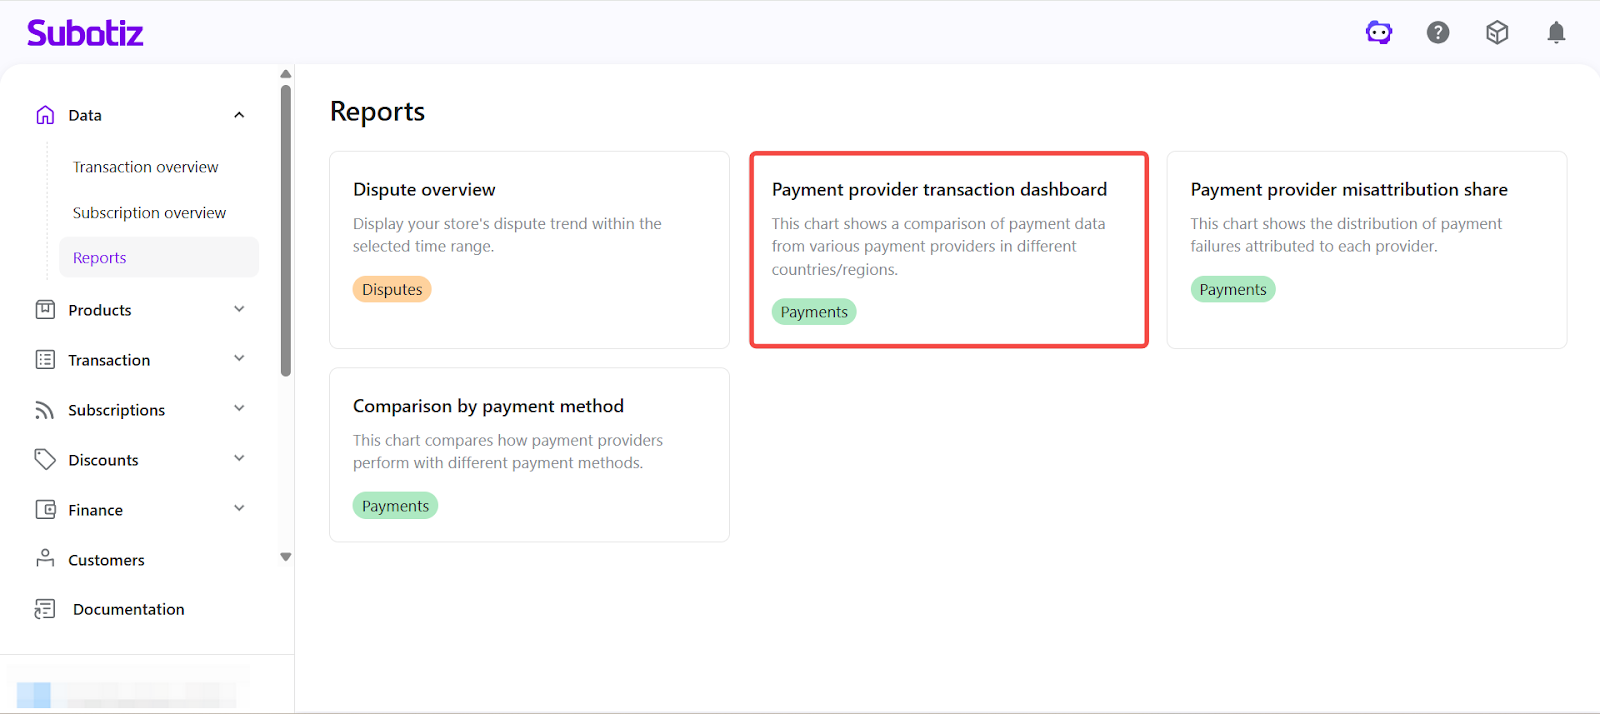
- Open the dashboard: Click Payment provider transaction dashboard to enter the analytics page.
Configuring Dashboard Filters
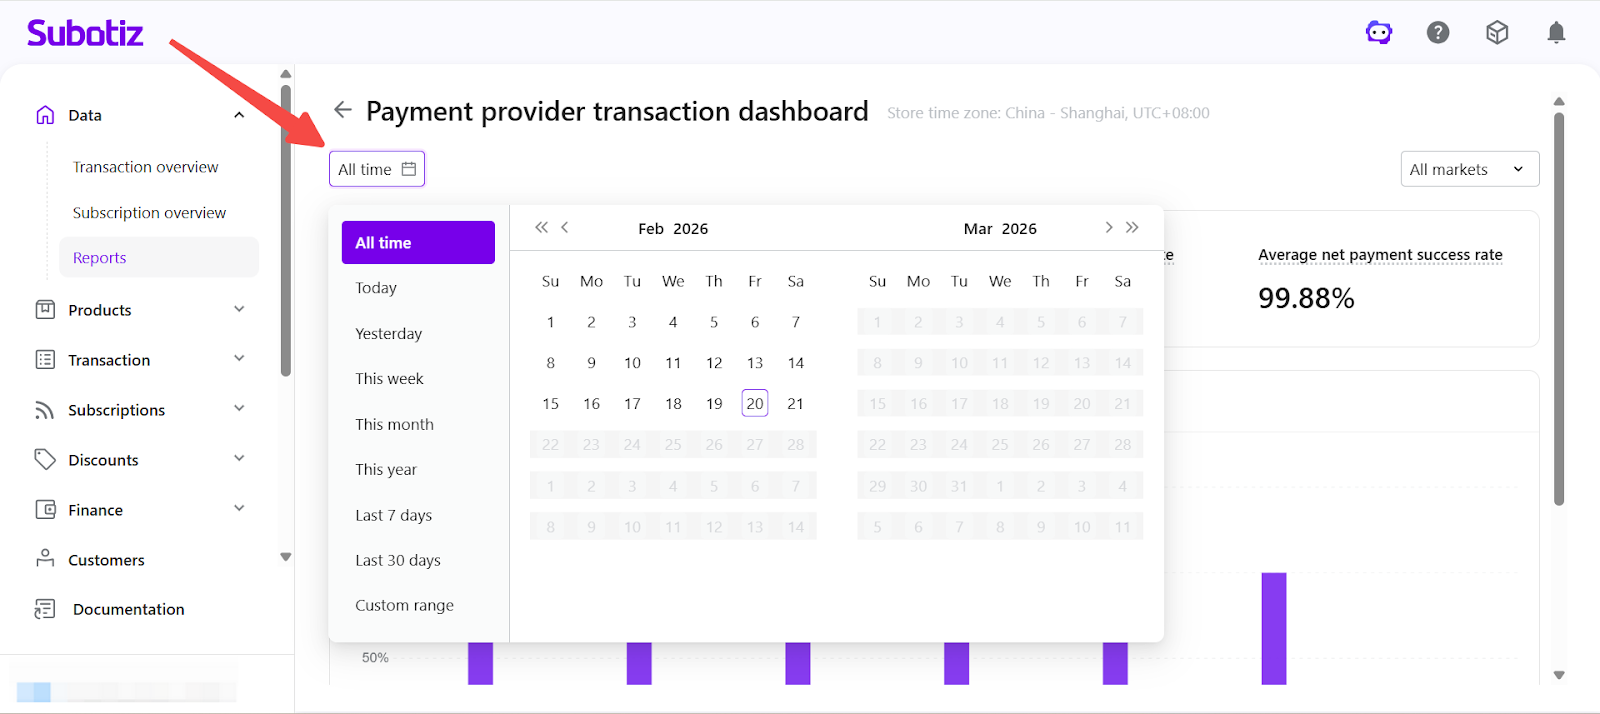
- Select time range: Click the All time selector in the upper-left corner and choose a predefined range such as Today, This week, Last 7 days, Last 30 days, This year, or set a Custom range. The selected time range applies to all metrics and visualizations on the dashboard.
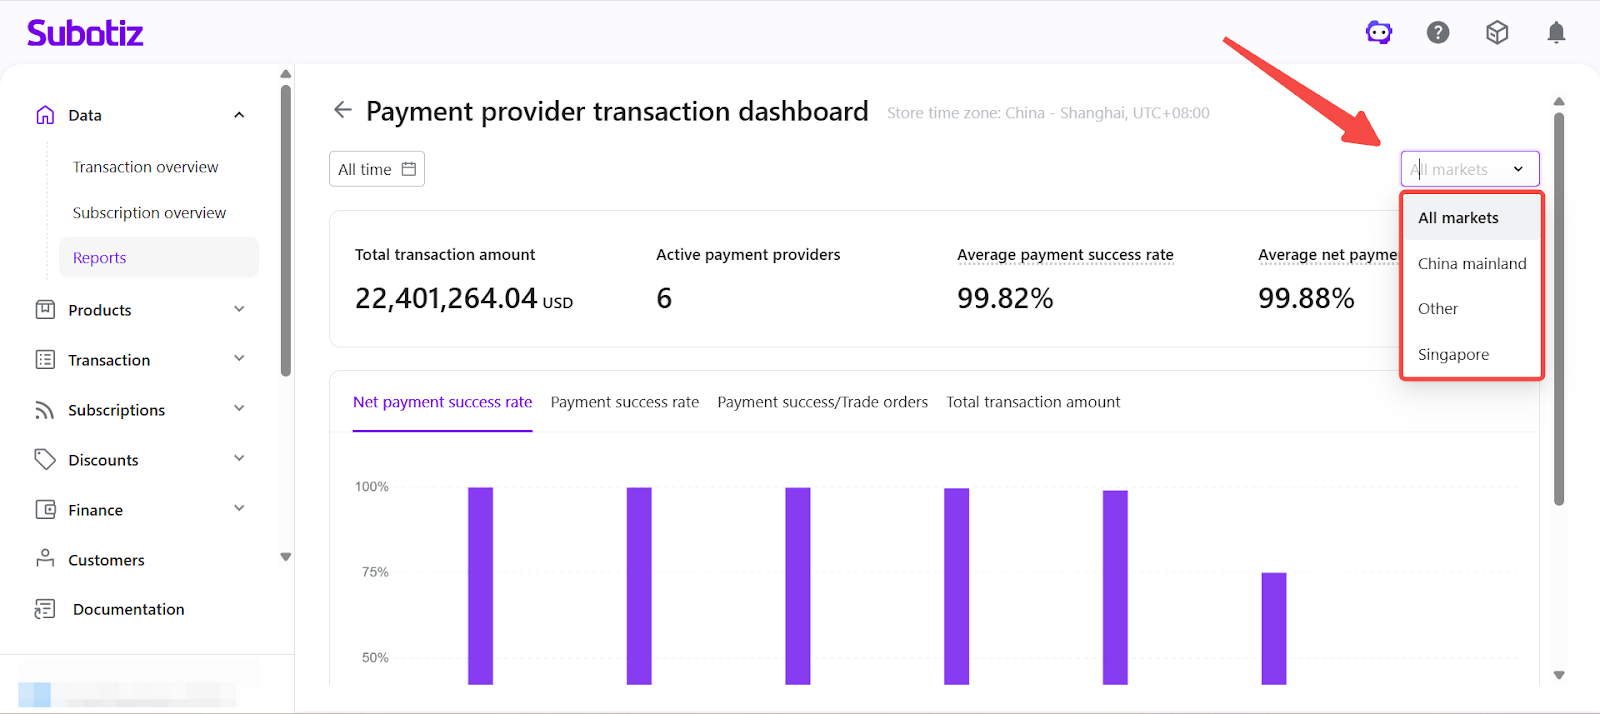
- Filter by market: Click the All markets dropdown in the upper-right corner to select from available markets. The market list is dynamically generated based on the merchant’s active markets and transaction data within the selected time range. Market filtering allows region-level comparison of payment provider performance.
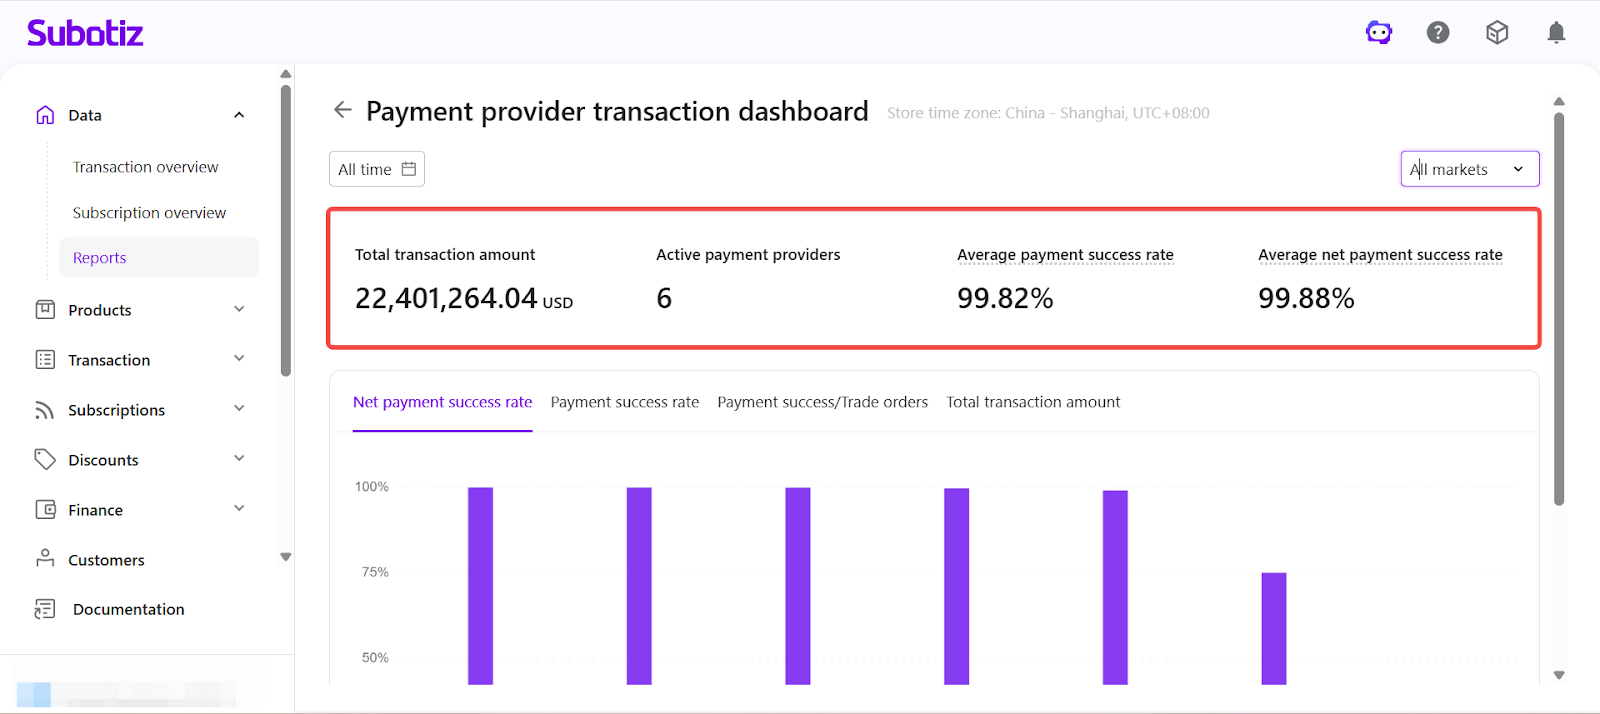
Reviewing Core Metrics
Metrics are calculated based on completed trade orders within the selected time range.
The dashboard header displays the following key performance indicators:
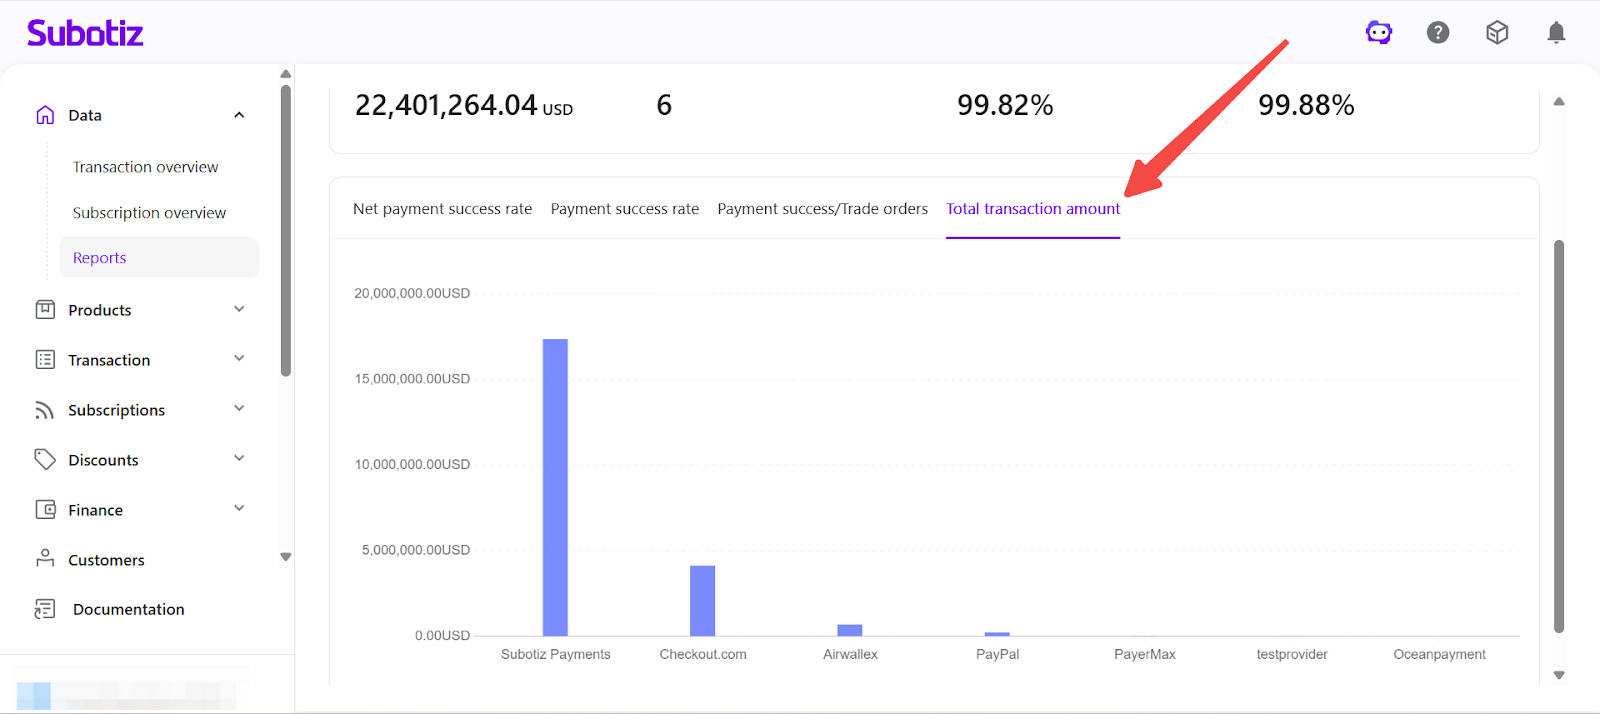
- Total transaction amount: Total processed transaction value within the selected time range.
- Active payment providers: Number of providers that processed transactions during the selected period.
- Average payment success rate:
- Formula: Successful orders for all providers ÷ Total trade orders.
- Average net payment success rate:
- Formula: Successful orders for all providers ÷ (Total trade orders − Customer-related failed orders).
These metrics provide a consolidated view of payment stability, provider activity, and authorization efficiency.
Analyzing Provider-Level Performance
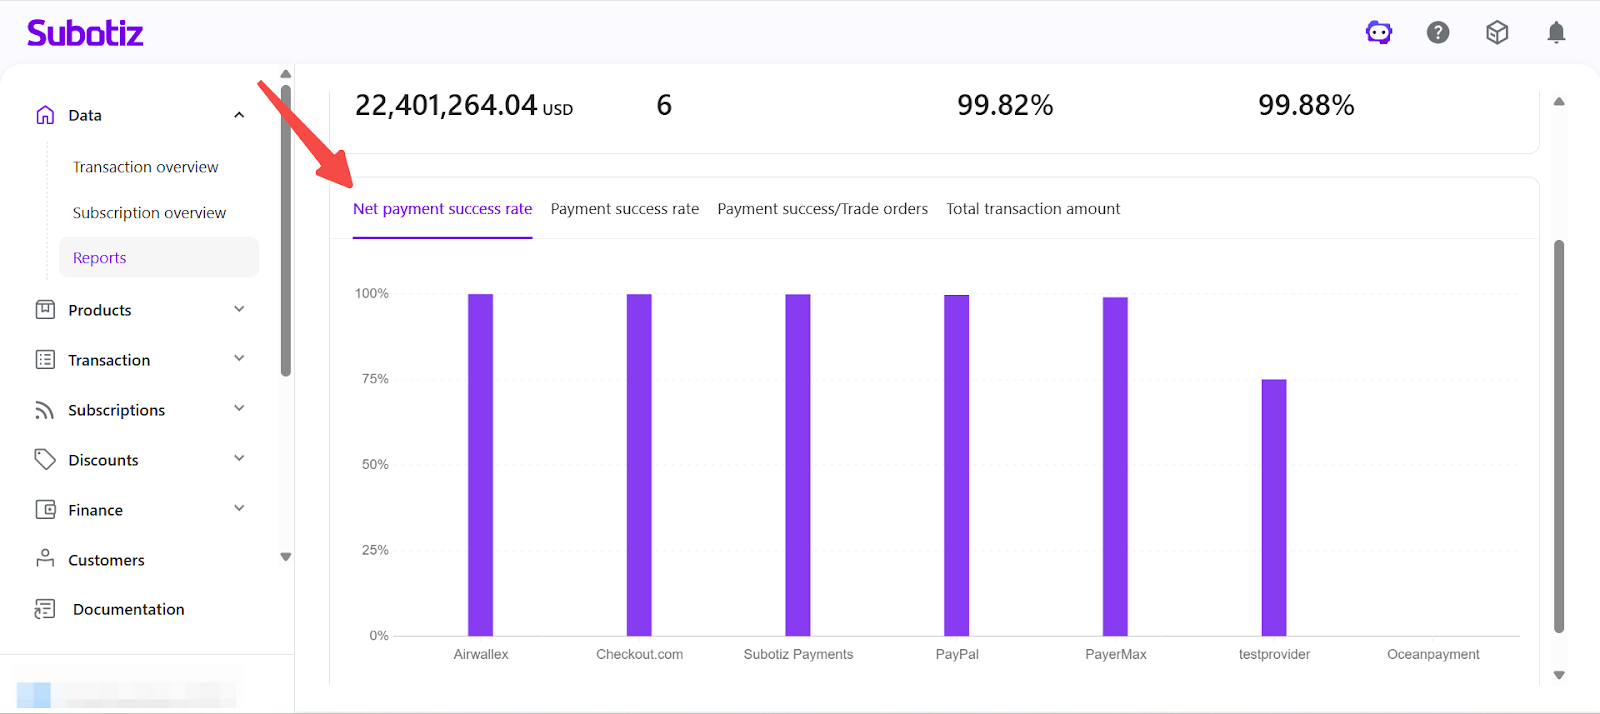
The dashboard provides four analytical views. Select each tab to switch between performance perspectives.
- Net Payment Success Rate: Click Net payment success rate to compare provider-level authorization performance after excluding customer-related failures.
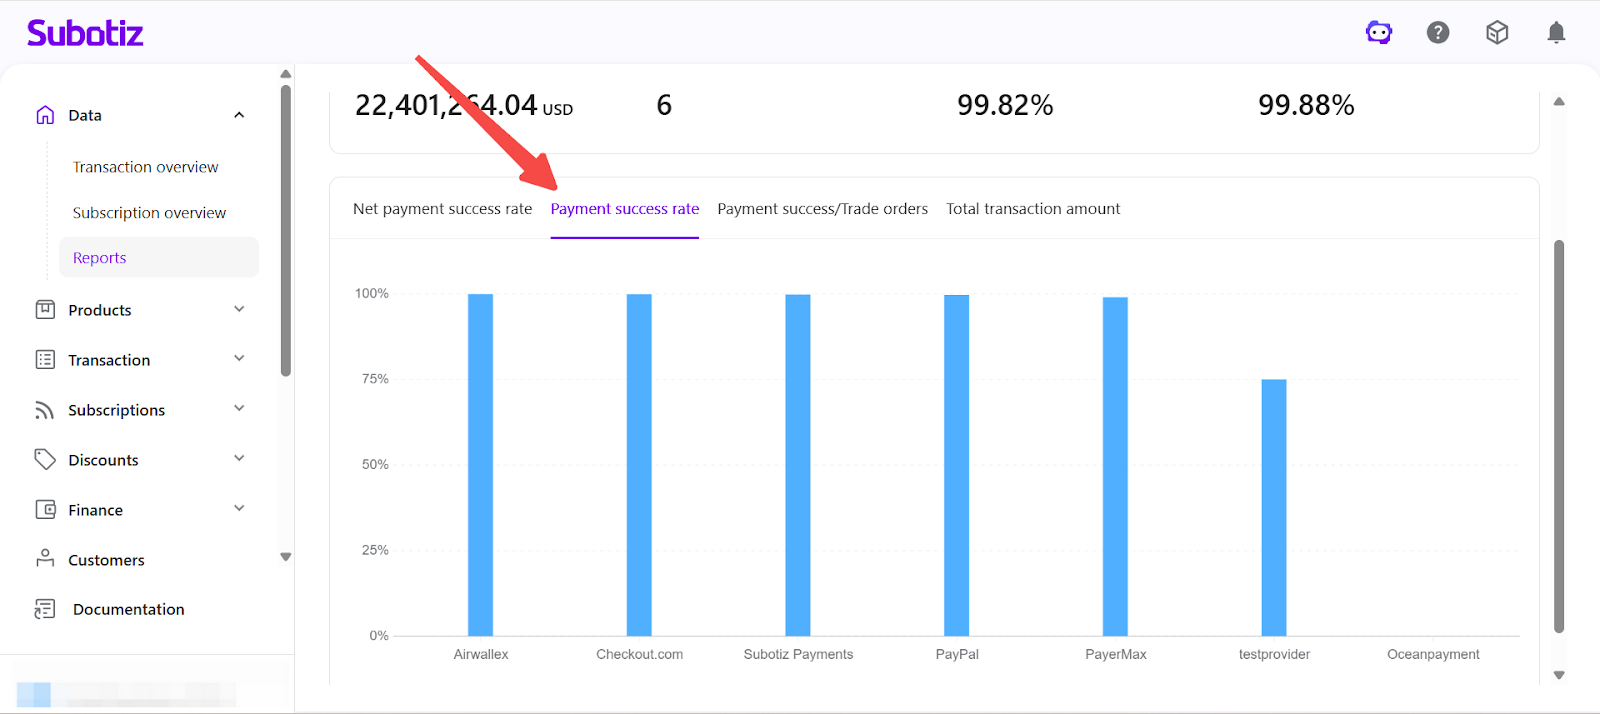
- Payment Success Rate: Click Payment success rate to compare overall authorization performance based on successful payments and total trade orders.
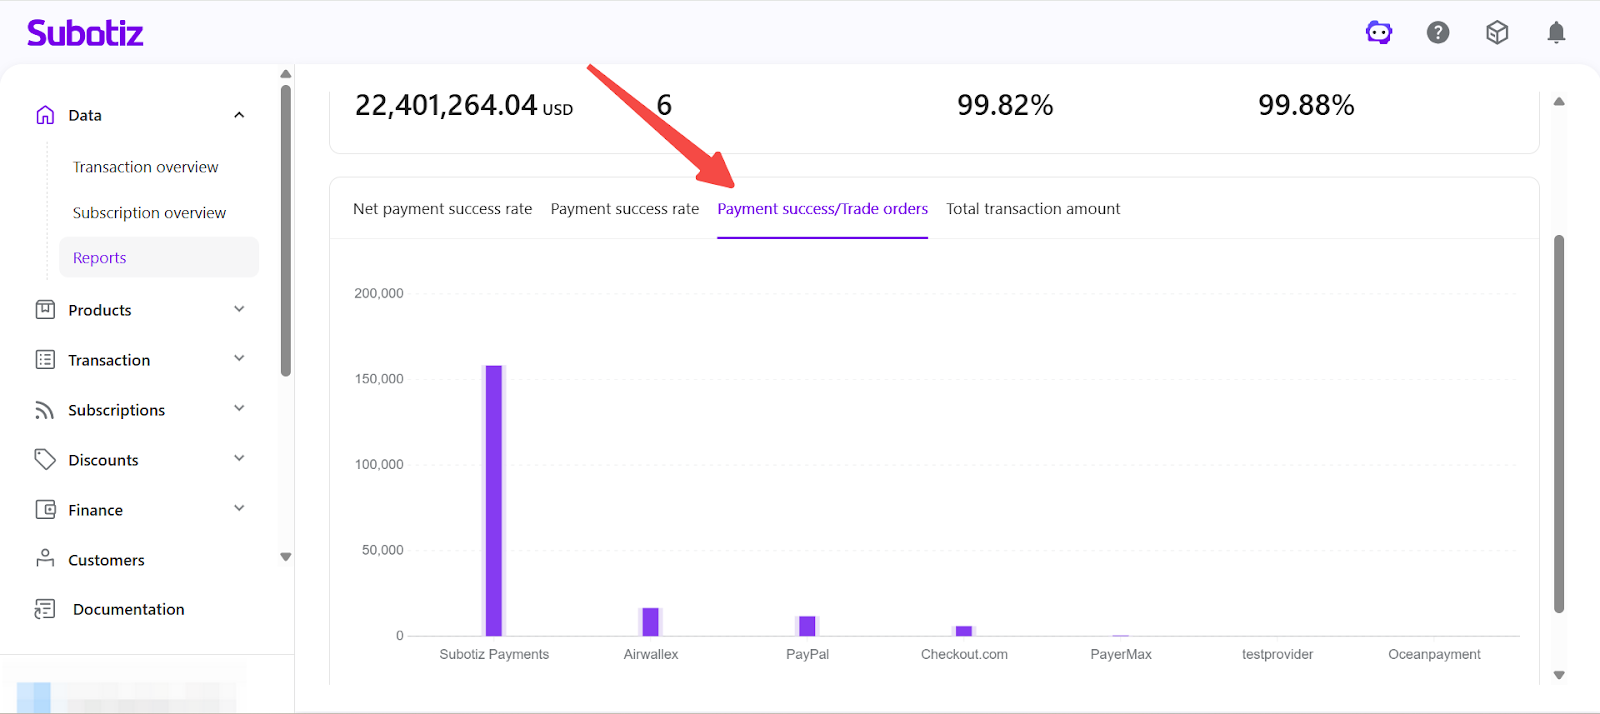
- Payment Success / Trade Orders: Click Payment Success / Trade Orders to compare total trade orders and successful orders by provider.
- Provider-level volume distribution
- Successful order count
- Conversion gaps between attempted and successful payments
- Total Transaction Amount: Click Total transaction amount to compare the total processed transaction value handled by each payment provider and evaluate revenue contribution, routing effectiveness, and provider concentration risk.
Best Practices
- Monitor performance trends regularly: Review payment success metrics weekly to detect performance fluctuations early.
- Compare by market: Use the market filter to identify region-specific authorization issues.
- Balance transaction volume across providers: Avoid over-concentration on a single provider to reduce operational risk.
- Investigate low performers: Cross-reference low success rates with dispute data or provider logs.
The Payment provider transaction dashboard provides a centralized, data-driven view of payment performance across providers and regions. By analyzing success rates, order volume, and transaction value, merchants can refine payment strategy and strengthen revenue stability.