The Subscription Overview provides a unified view of your subscription analytics across growth, revenue, renewals, and customer lifecycle behavior. By combining summary metrics with renewal-cycle analysis, this dashboard presents a clear view of subscription performance over time. This view supports ongoing subscription operations, pricing evaluation, and retention planning by centralizing key subscription metrics.
Accessing Subscription Overview
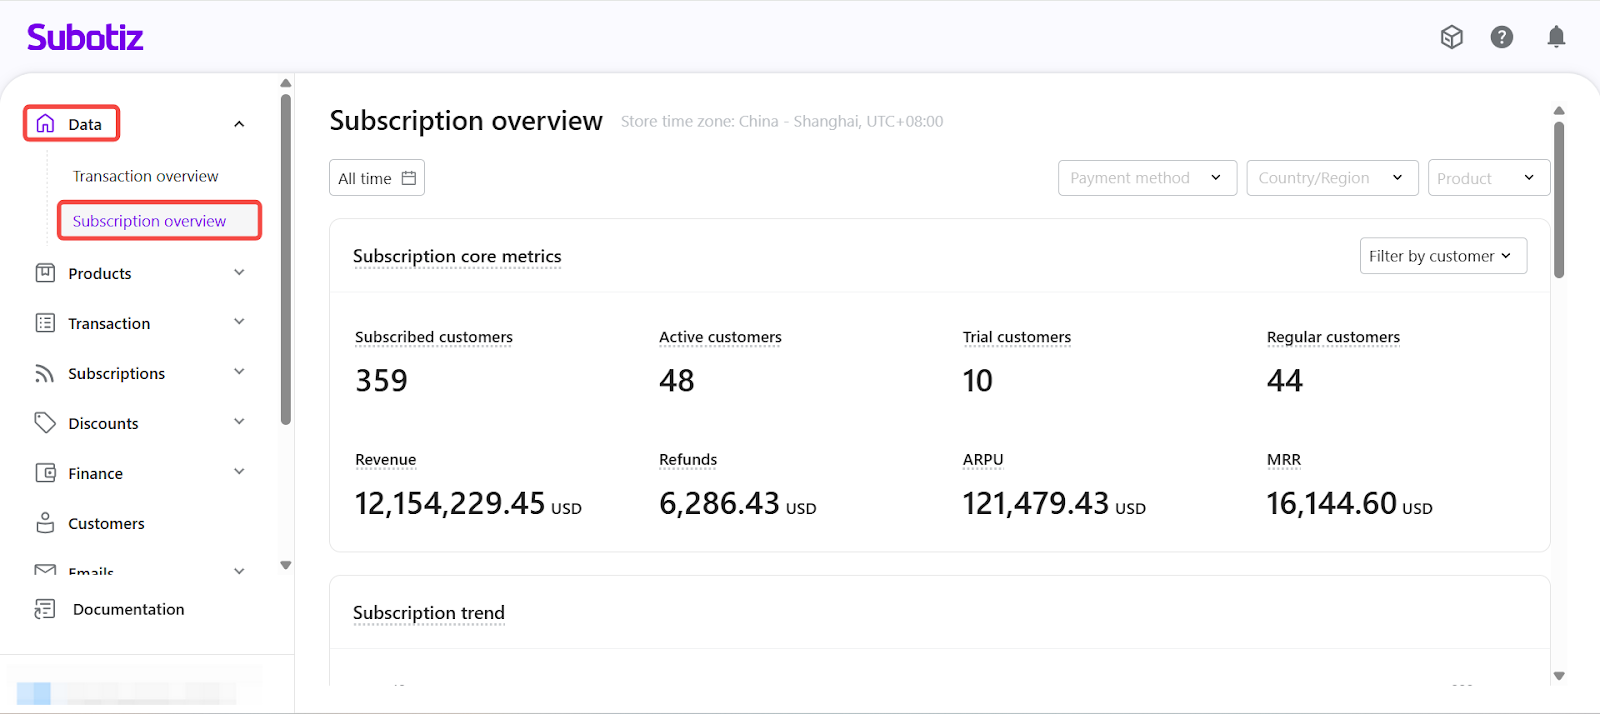
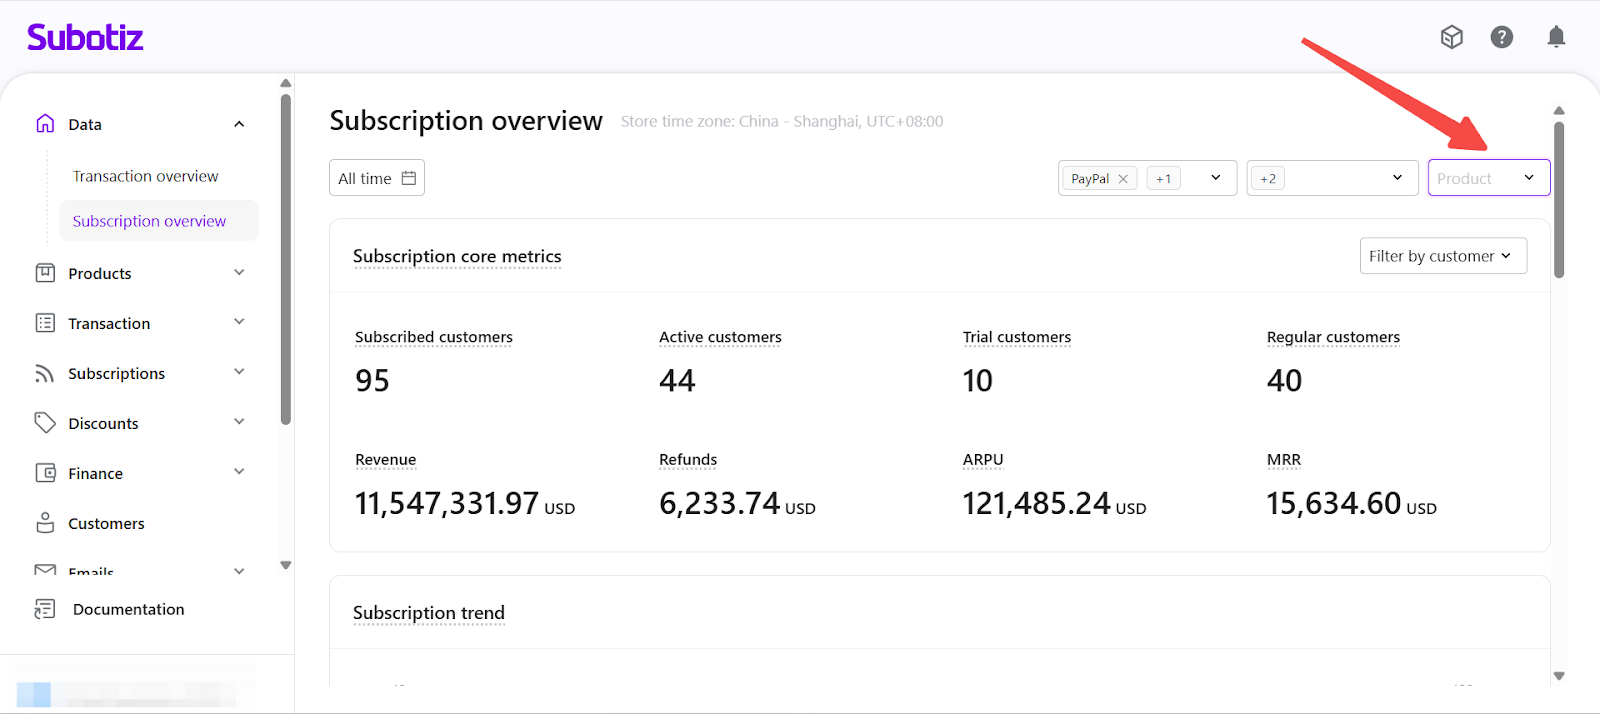
- To open the Subscription Overview: From Subotiz Admin, go to Data > Subscription Overview.
Time Range & Filters
All metrics, charts, and trend views on this page are controlled by the filters at the top of the page. Once applied, filters affect every section consistently to ensure aligned data interpretation across the dashboard.
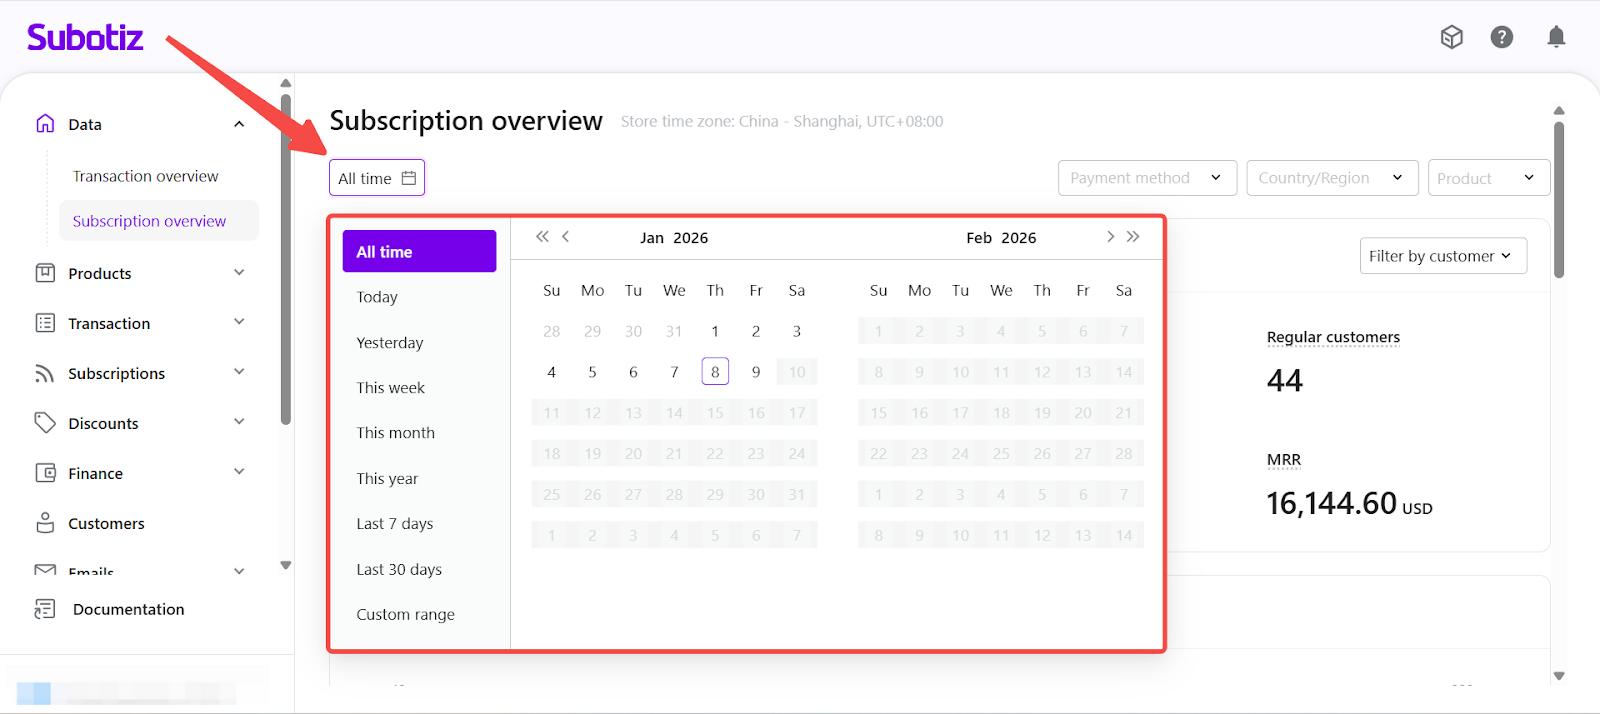
- Time Range: The time range defines which subscriptions are included in the analysis.
- All time: Displays data for all subscriptions created since subscriptions were first enabled. This option is best suited for long-term trend analysis and overall business health review.
- Custom time range: Focuses the analysis on subscriptions created within a specific period. This is commonly used for short-term performance evaluation or campaign impact analysis.
- Typical use cases include:
- Last 7 days: Monitor recent subscription growth, early renewals, or immediate post-campaign effects.
- Last 30 days: Review performance across a full operating cycle, including revenue stability and churn.
- Specific campaign period (e.g., Jan 1–Jan 7): Measure the impact of promotions, pricing changes, or new plan launches.
- Post-change analysis: Evaluate subscription behavior after adjustments to billing rules, renewal logic, or payment methods.
- When a custom time range is selected, only subscriptions created within that period are included. Their renewal and lifecycle activity is tracked through the current date.
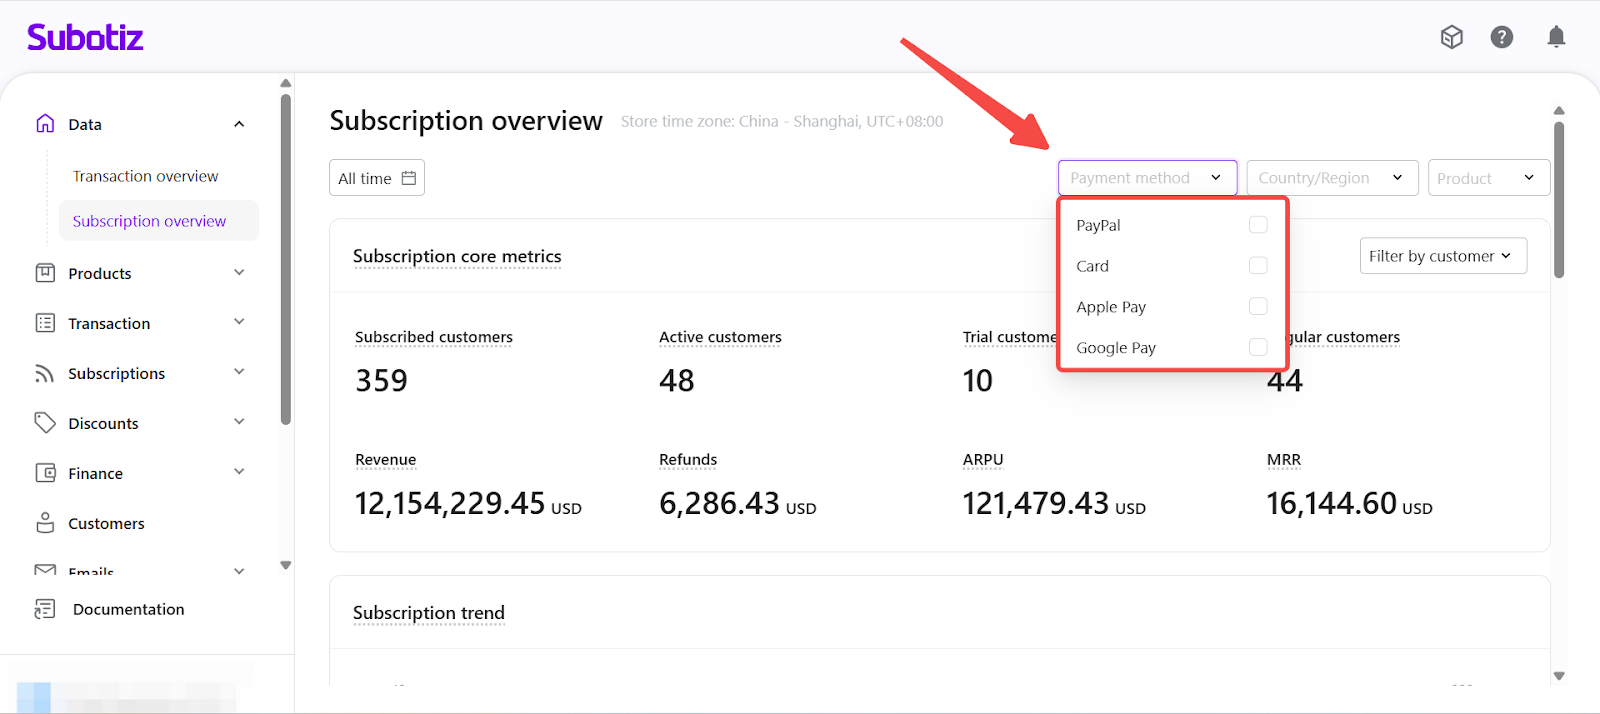
- Additional Filters: You can further refine your analysis using the following dimensions:
- Payment Method: Limits the dataset to subscriptions paid using selected payment channels. This is useful for comparing renewal performance, churn behavior, and revenue contribution across different payment methods.
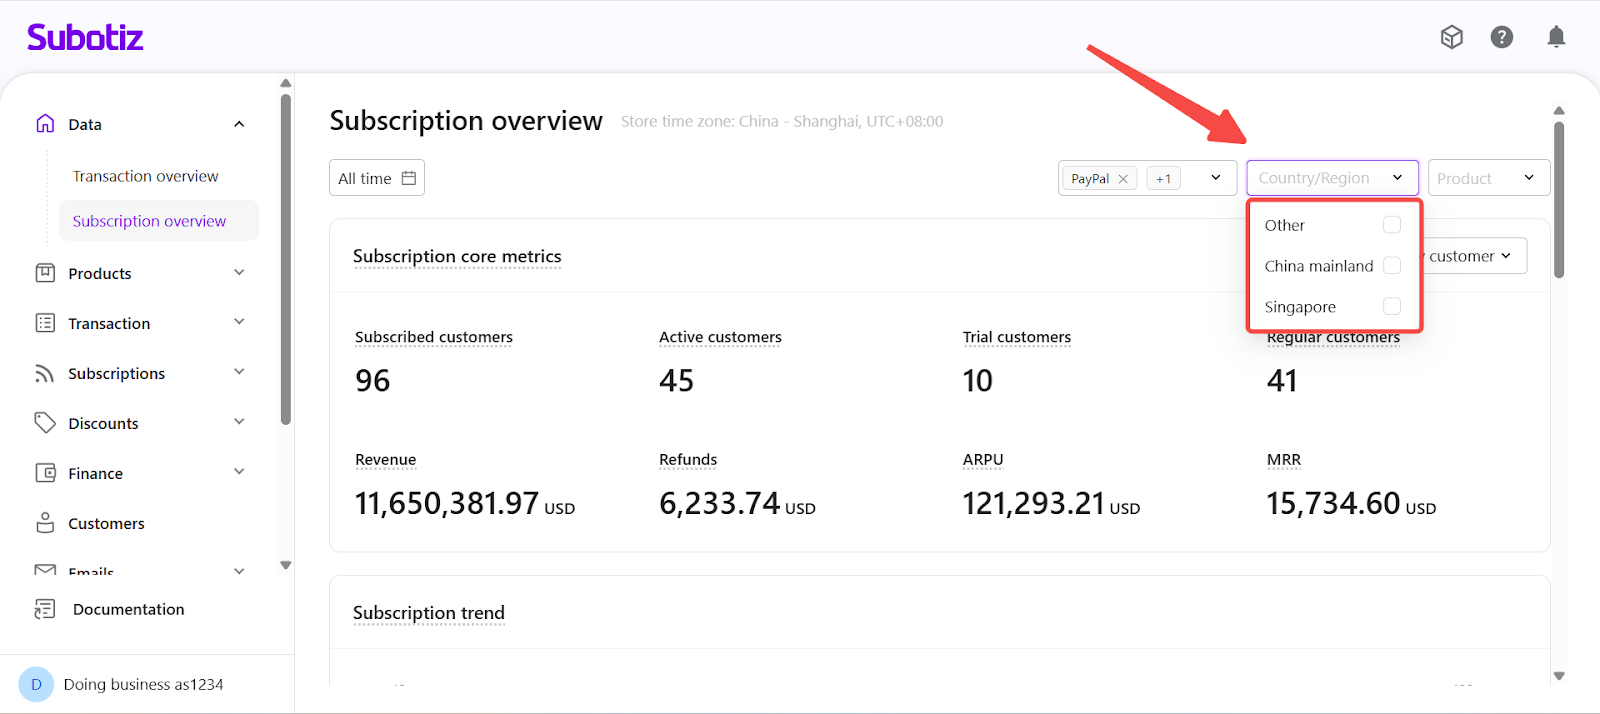
- Country / Region: Analyzes subscription performance by customer location, based on checkout or access origin. This helps identify regional retention trends and location-specific performance patterns.
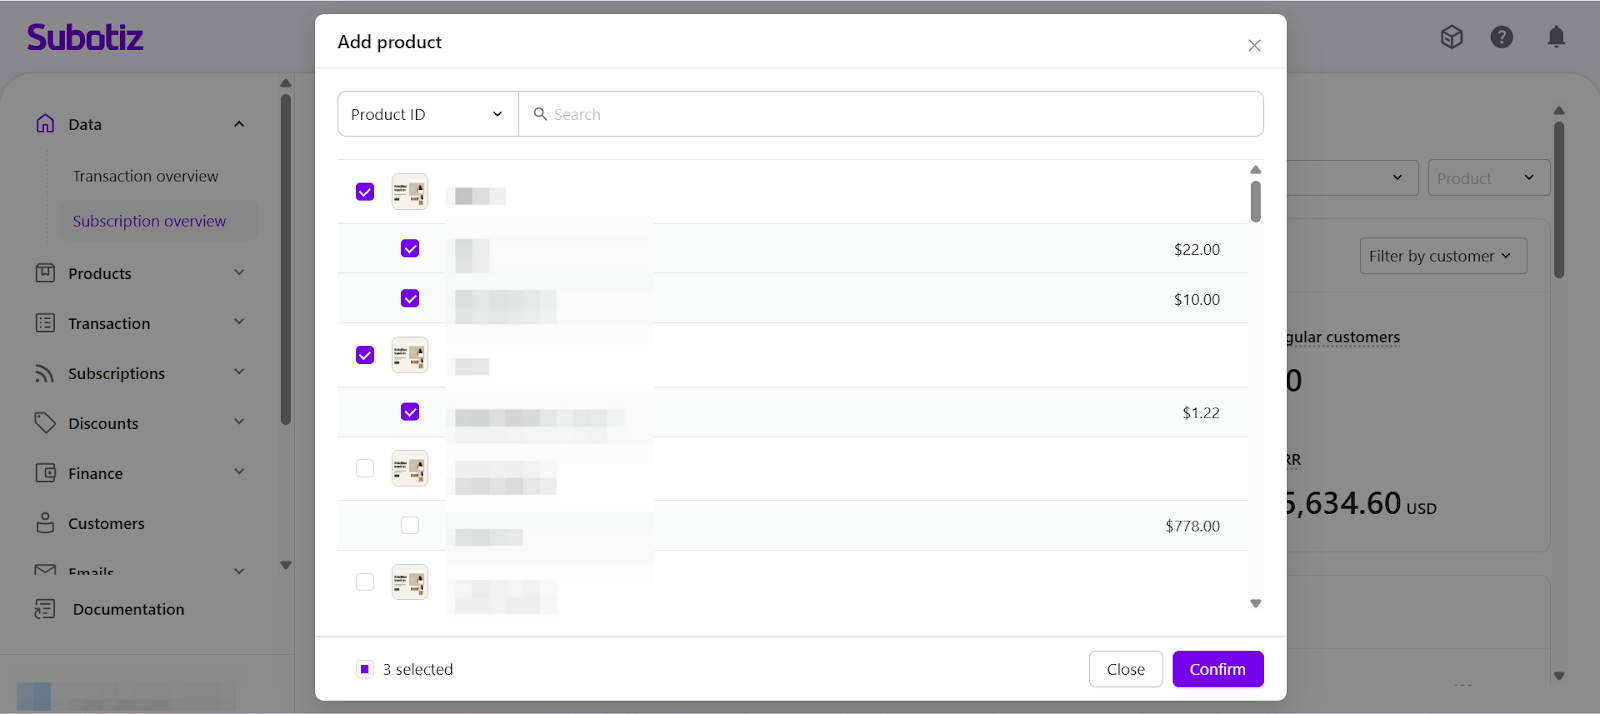
- Product: Restricts the analysis to selected subscription products or plans. All metrics are recalculated based on the selected product set, making this view suitable for product-level performance comparison.
- Combined Filters: All filters can be applied at the same time. When multiple filters are active, only subscriptions that meet all selected conditions are included in the analysis.
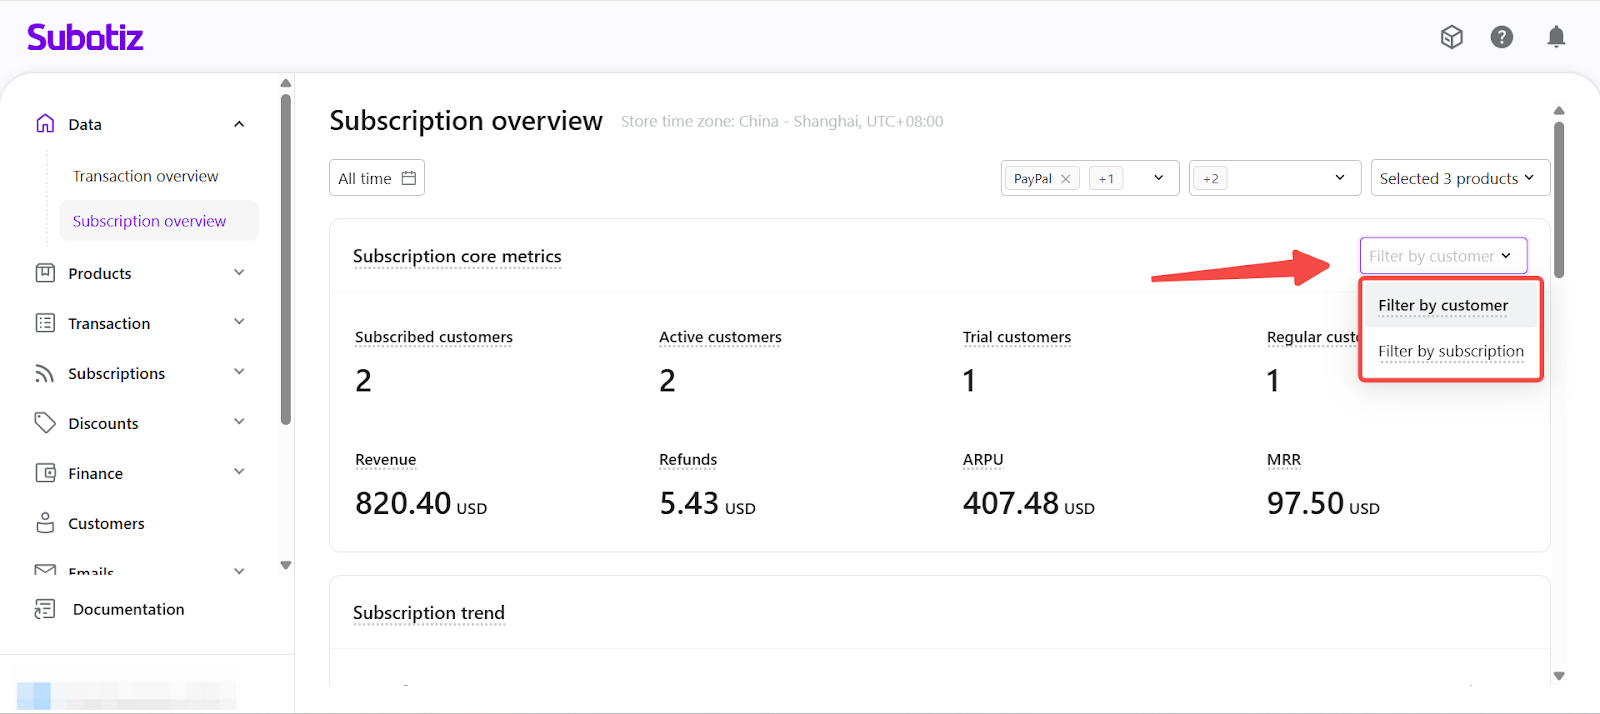
Subscription Summary Metrics
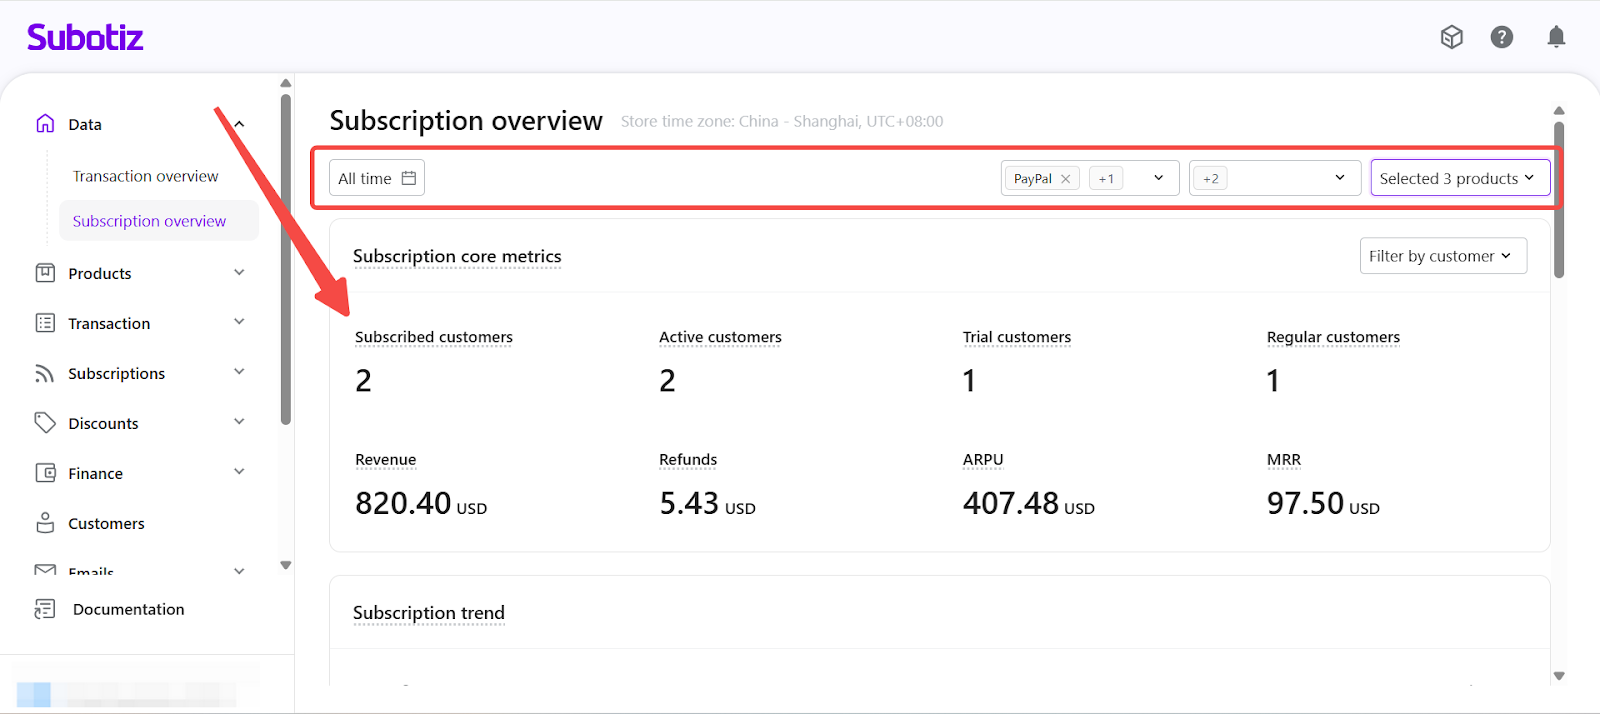
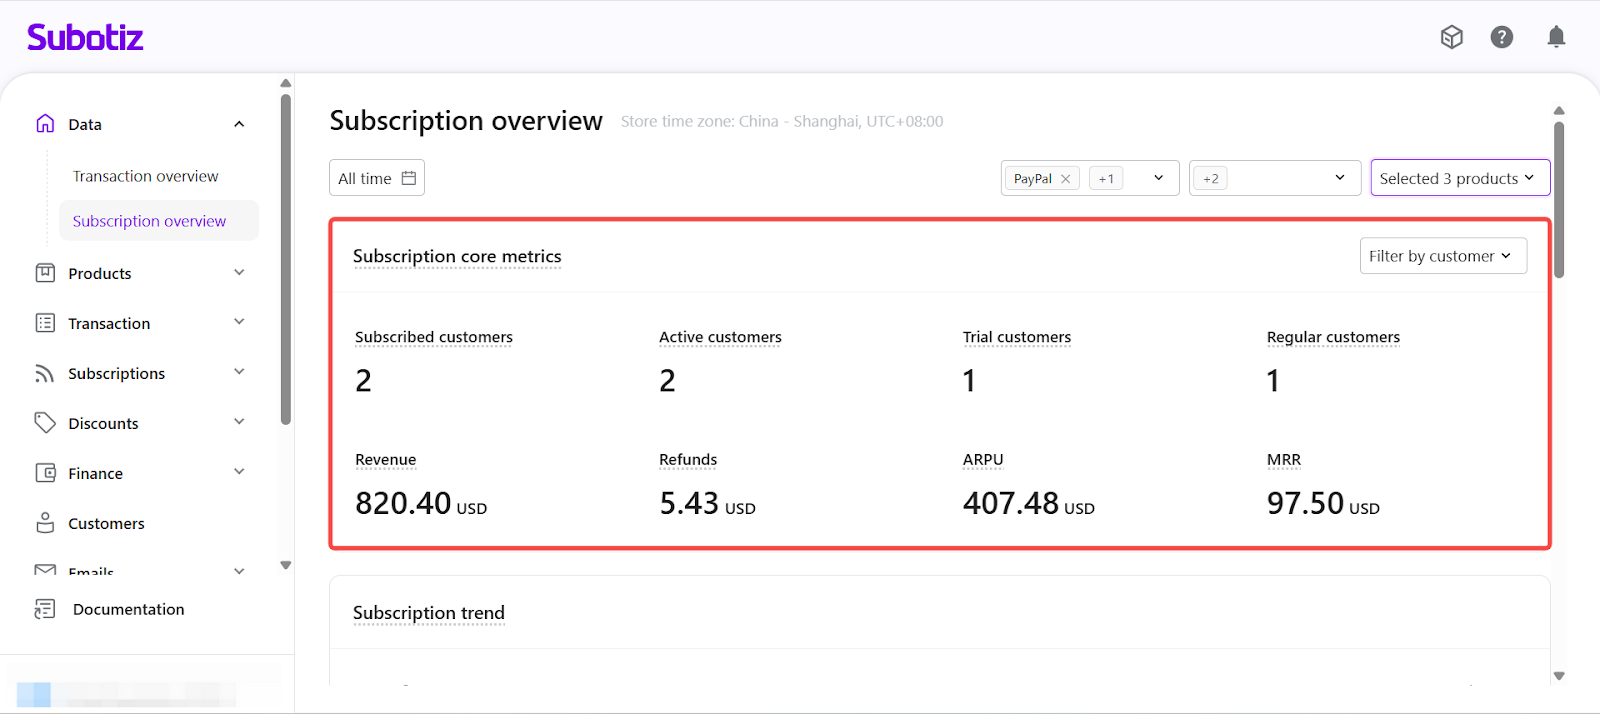
This section provides a high-level snapshot of your subscription scale, revenue performance, and customer composition for subscriptions created within the selected time range.
Key Metrics
- Subscribed customers: The number of unique customers who successfully created and paid for at least one subscription during the selected time range. Customers are deduplicated by customer ID.
- Active customers: Number of unique customers with at least one subscription created within the selected time range that remains active as of the current date.
- Trial customers: Number of unique customers whose subscriptions are currently within a trial period.
- Regular customers: Number of unique customers with active subscriptions that have exited trial and entered a paid billing cycle.
- Revenue: Gross amount of all successfully paid subscription invoices generated by subscriptions created within the selected time range. Refunds are not deducted from this value.
- Refunds: Total amount successfully refunded for subscriptions created within the selected time range.
- ARPU (Average Revenue Per User): (Total subscription revenue − Total subscription refunds) ÷ Number of unique subscribed customers. This reflects the average net revenue generated per subscribing customer during the selected period.
- MRR (Monthly Recurring Revenue): Normalized monthly recurring revenue from all active subscriptions at the current point in time. MRR is calculated based on each subscription’s current billing cycle price and converted to a monthly value, regardless of whether the plan bills monthly, quarterly, or annually.
- Metric Perspective: You can switch between two calculation perspectives using the Metric dimension selector:
- Customer View: Metrics are calculated per unique customer. Each customer is counted once, regardless of how many subscriptions they hold. This view is useful for understanding customer scale, structure, and average customer value.
- Subscription View: Metrics are calculated per subscription contract. Customers with multiple subscriptions are counted multiple times. This view is helpful for analyzing plan adoption, contract volume, and multi-subscription behavior.
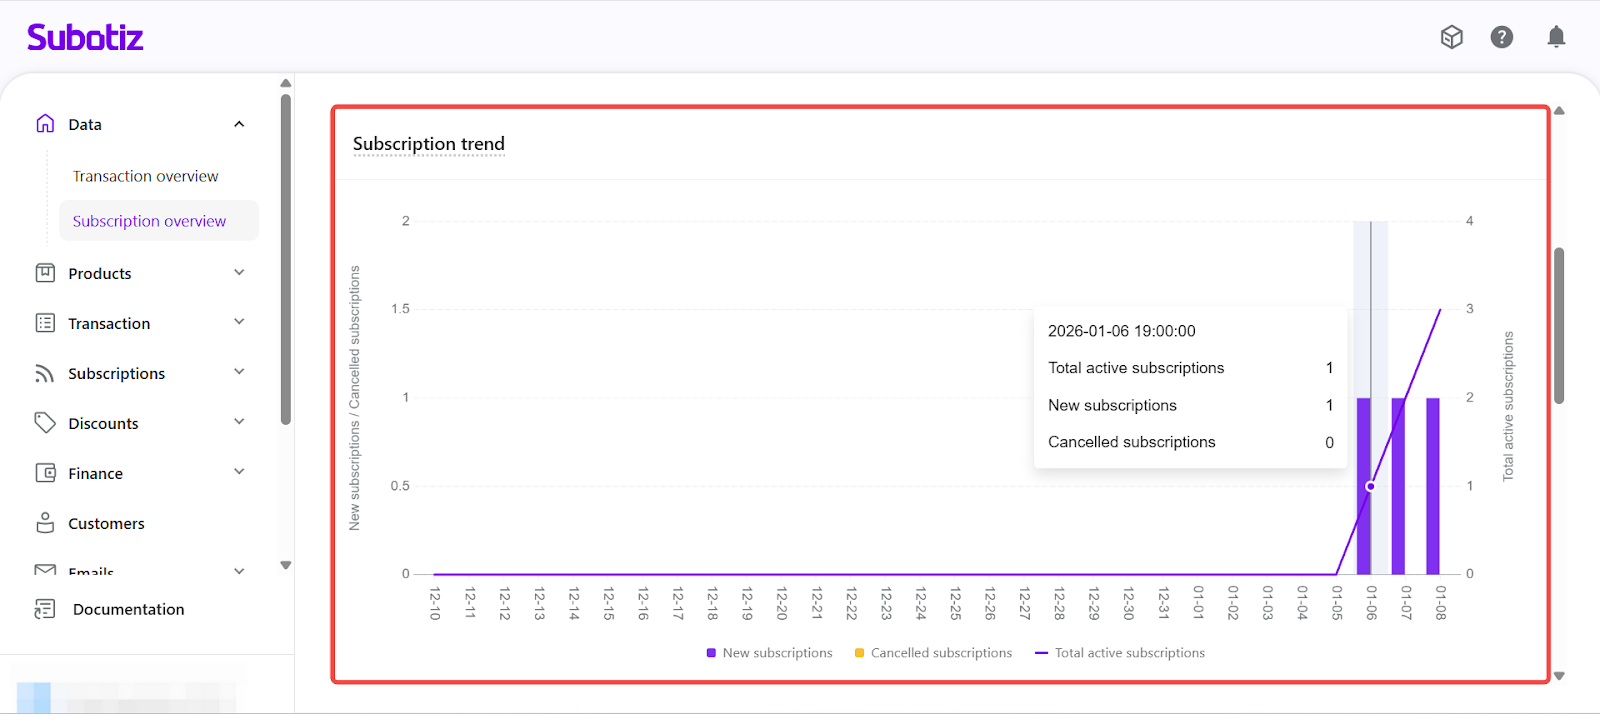
Subscription Trend
The Subscription Trend visualizes how your subscription base changes over time.
- New subscriptions: Subscriptions created during each time interval.
- Canceled subscriptions: Subscriptions canceled during the same interval.
- Total active subscriptions: Running total of subscriptions that remain active at each point in time.
Chart Interpretation:
- Bar charts show the number of newly created subscriptions and canceled subscriptions.
- The line chart shows the trend of total active subscriptions over time.
- When new subscriptions consistently exceed cancellations, the active subscription base trends upward.
This view helps you identify:
- Whether subscription growth is accelerating or slowing.
- Periods with elevated cancellation activity.
- Overall momentum of subscription expansion.
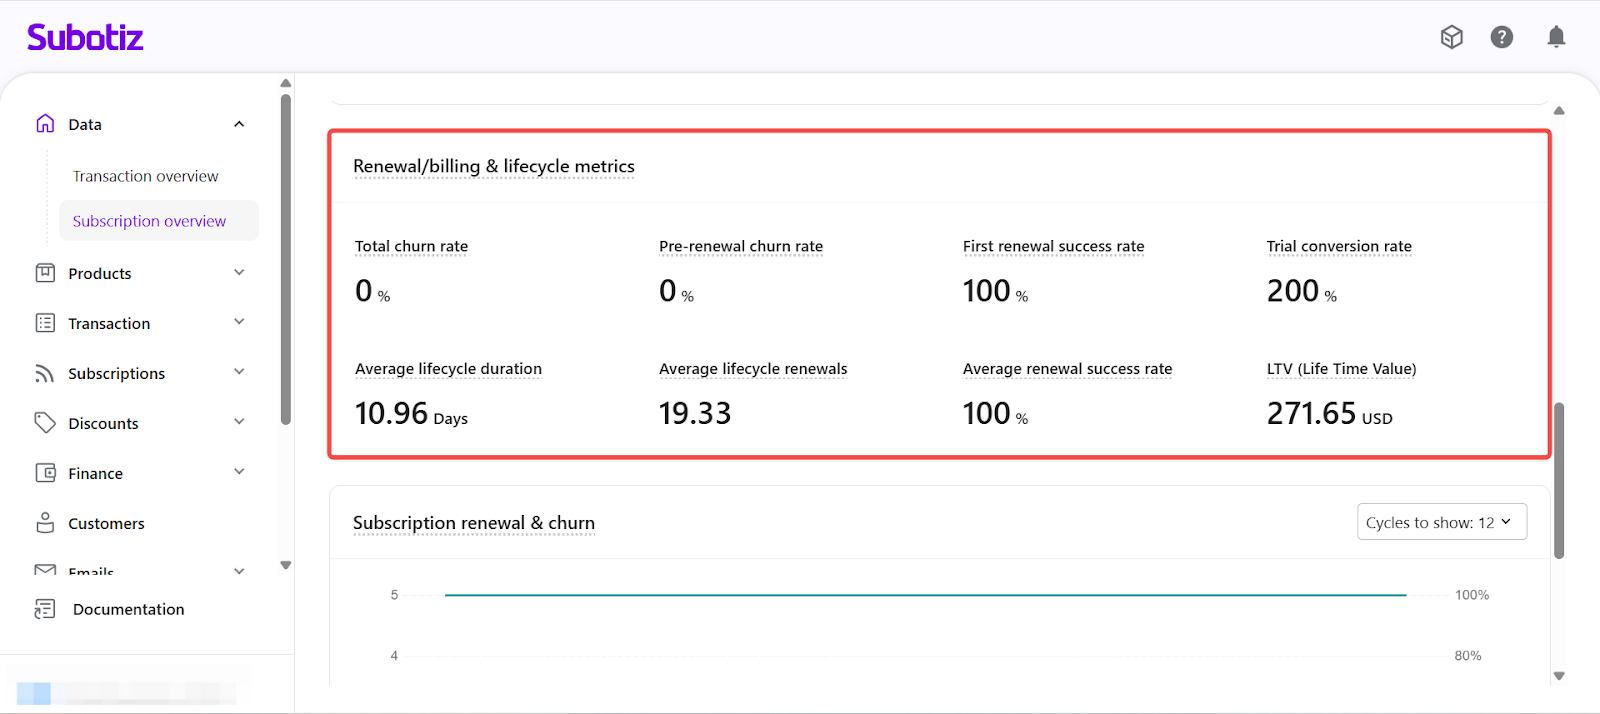
Renewal, Billing & Lifecycle Metrics
This section focuses on renewal behavior and lifecycle quality for subscriptions created within the selected time range, with lifecycle metrics observed up to the present.
Key Indicators
- Total churn rate: Canceled subscriptions ÷ total subscriptions.
- Pre-renewal churn rate: Subscriptions canceled before a renewal invoice was generated ÷ total subscriptions.
- First renewal success rate: Successful first renewals ÷ first renewal attempts.
- Trial conversion rate: Percentage of subscriptions that entered a trial during the selected time range and successfully converted to a paid plan after the trial ended.
- Average lifecycle duration: Average actual service duration from effective date to expiration, including both trial and paid periods. For subscriptions canceled early, the duration is calculated up to the service expiration date.
- Average lifecycle renewals: Average number of successful paid renewals per subscription, measured from creation to the observation date (or until cancellation).
- Average renewal success rate: Average renewal success rate across all renewal attempts throughout the subscription lifecycle.
- LTV (Lifetime Value): Average total revenue generated per subscription over its lifecycle, including the initial payment and all successful renewals. For subscriptions that are still active, LTV is calculated up to the current observation date.
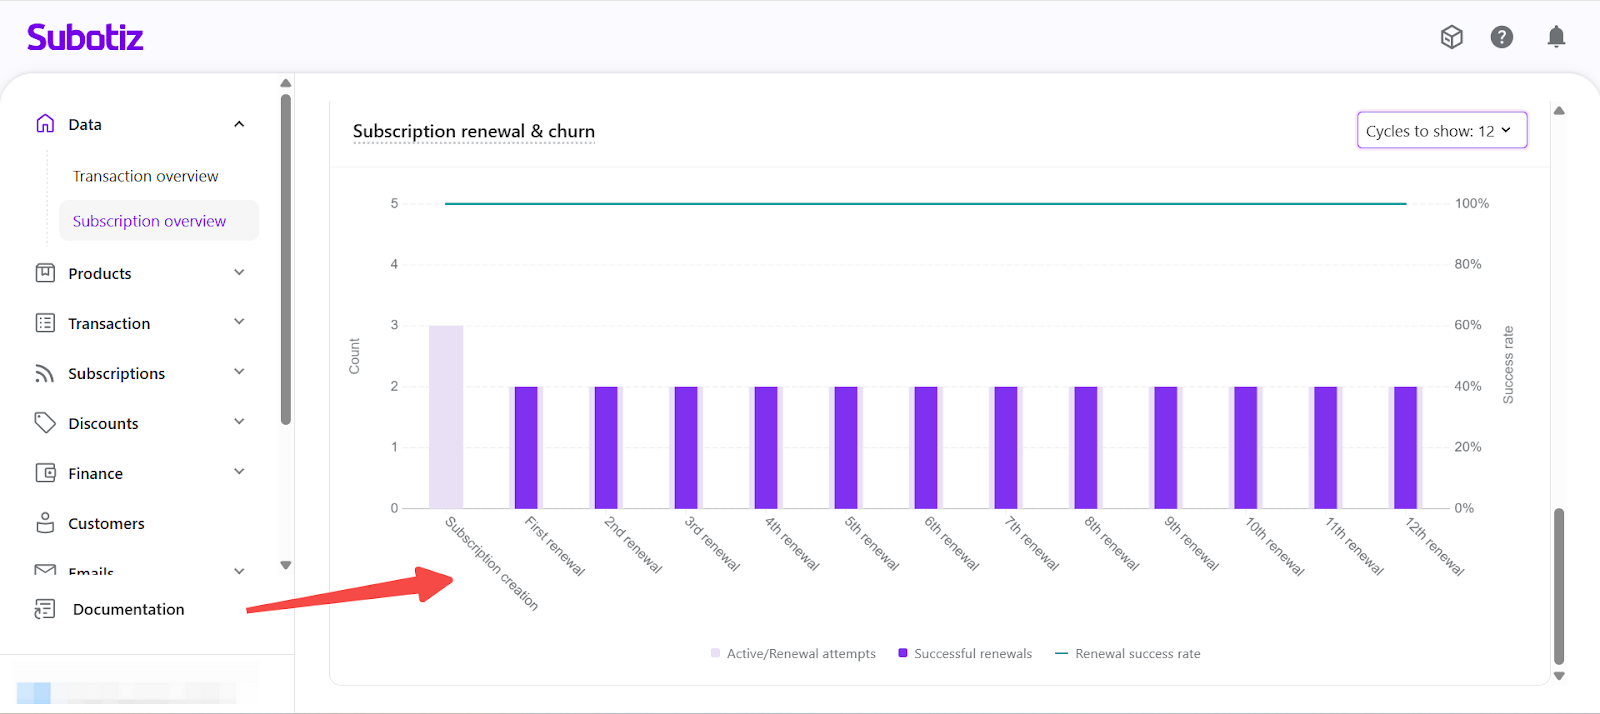
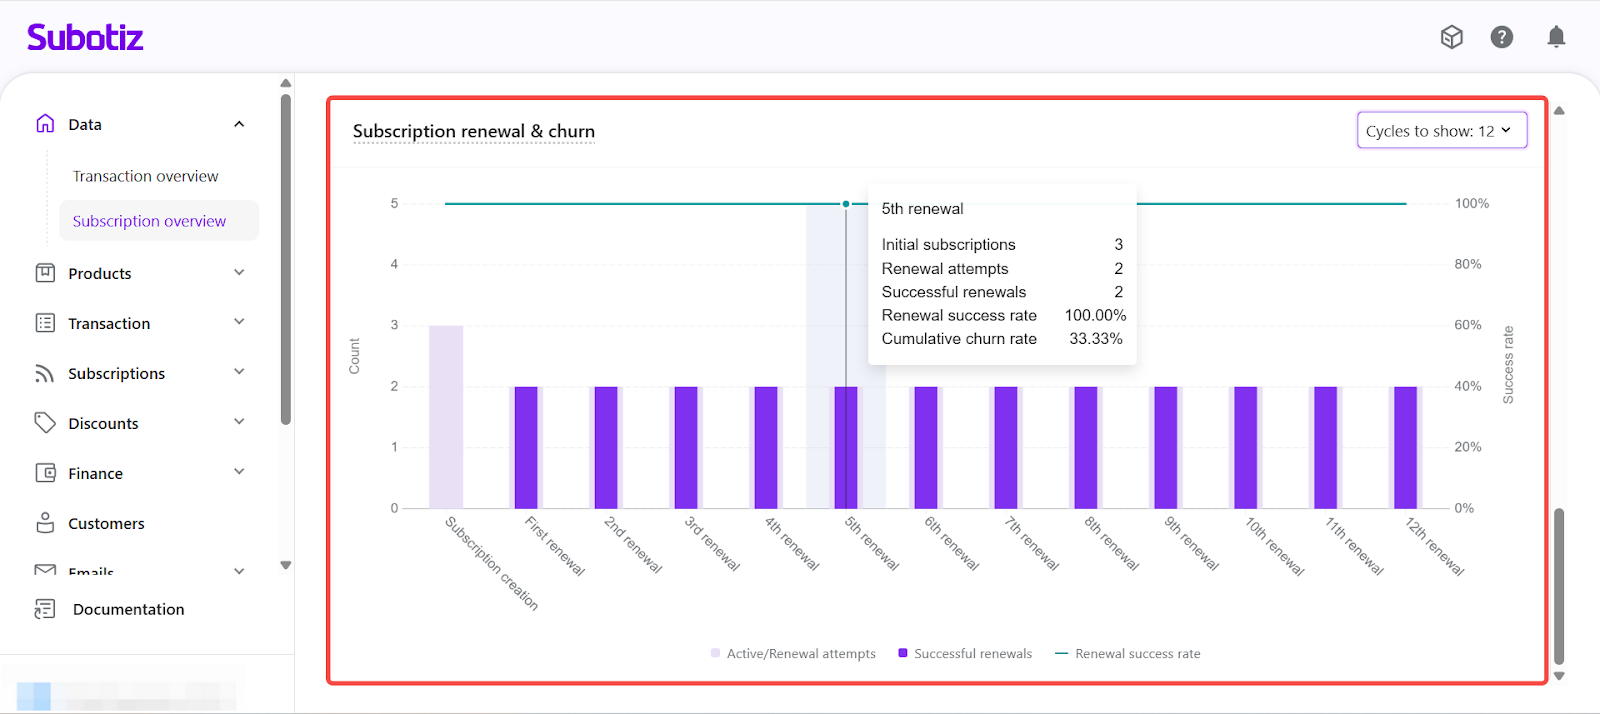
Subscription Renewal & Churn Analysis
The Subscription Renewal & Churn chart breaks down renewal performance by renewal cycle for subscriptions created within the selected time range. This view shows how subscriptions progress through successive renewals and how renewal outcomes change over time.
- Renewal Cycle Depth: Use Cycles to show to control how many renewal cycles are included in the analysis:
- 12 cycles : Commonly used for monthly subscription products and shorter billing models.
- 24 cycles : Suitable for long-term subscription offerings or models with extended retention periods.
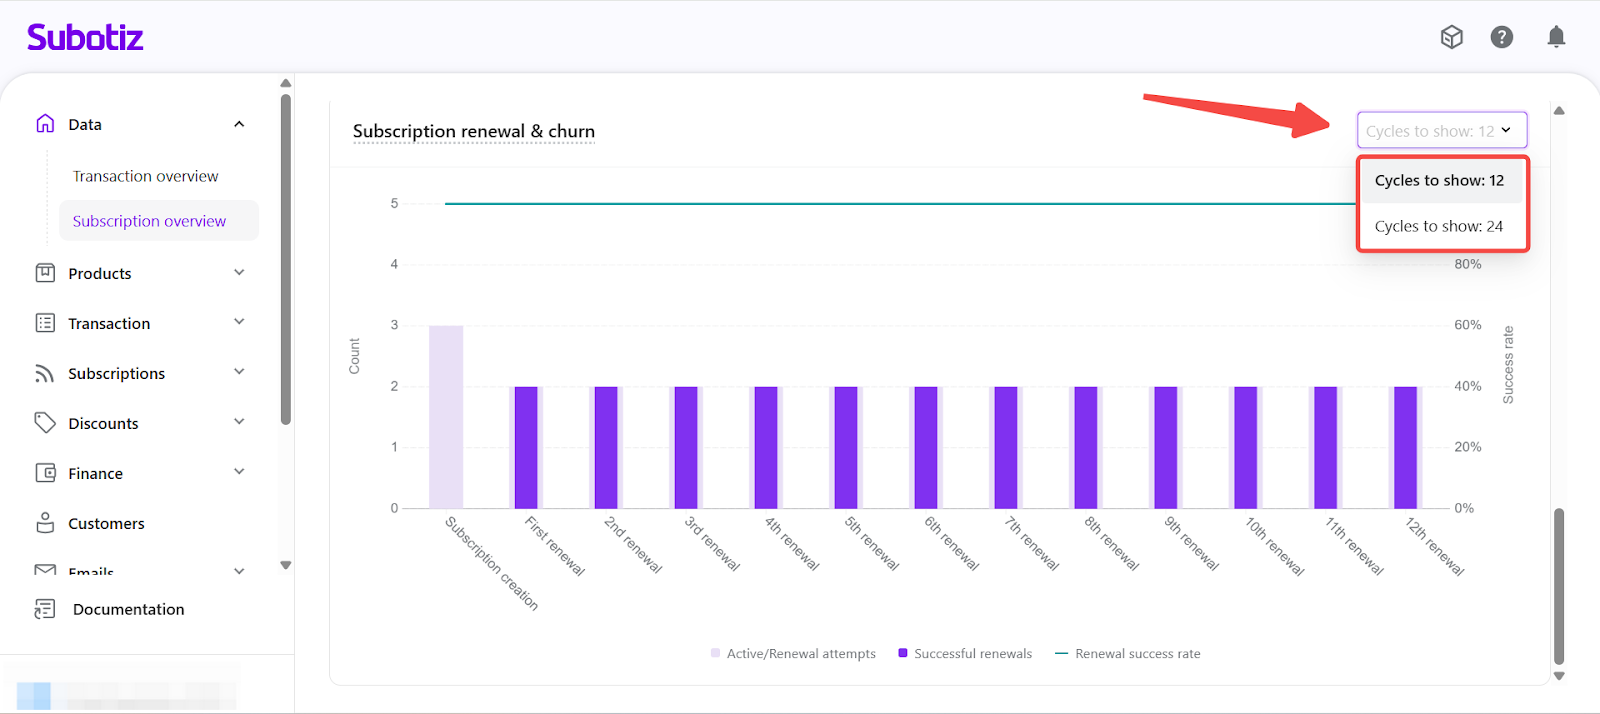
- Chart Structure
- Bars
- Active / Renewal attempts: Subscriptions entering each renewal cycle.
- Successful renewals: Subscriptions that successfully completed payment in that cycle.
- Line
- Renewal success rate: The percentage of successful renewals at each cycle.
- X-axis
- Subscription creation → 1st renewal → 2nd renewal → subsequent renewal cycles.
- Each step represents a renewal attempt sequence.
- Y-axis
- Left: Subscription count
- Right: Renewal success rate (%)
- This view helps you:
- Understand how renewal performance evolves across billing cycles.
- Identify stages where renewal behavior changes over time.
- Evaluate the long-term stability of your subscription retention model.
The Subscription Overview brings subscription scale, revenue performance, renewal efficiency, and lifecycle value into a single analytical framework. By combining flexible time controls with multi-dimensional filters, you can review performance at the market, product, or payment-method level and make informed decisions on pricing, renewals, and long-term subscription planning.