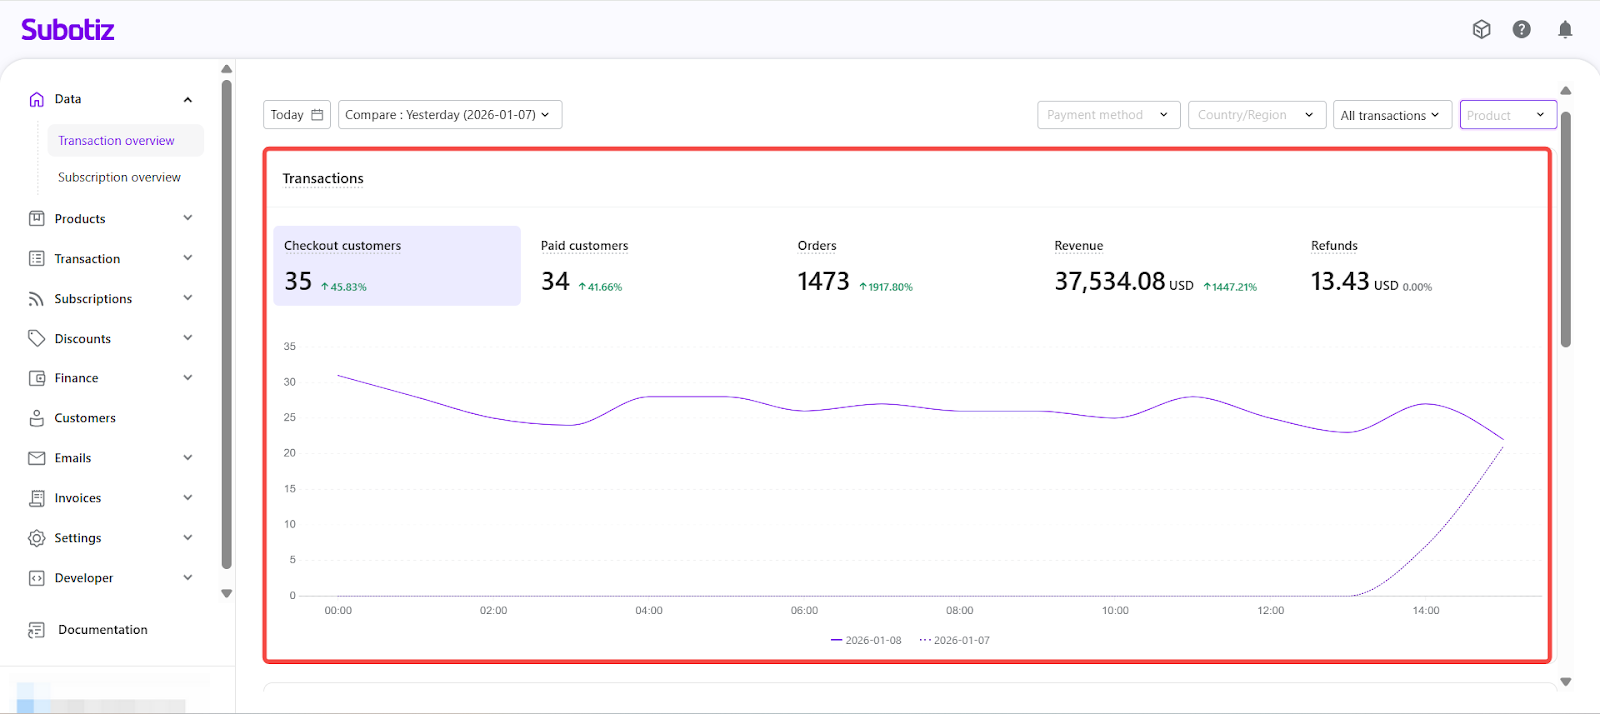
Transaction Overview is the core analytics view within Subotiz’s Data module. It provides a consolidated view of transaction performance, checkout conversion, and payment outcomes for a selected time period.
By combining standardized metrics with interactive visual reports and flexible filters, Transaction Overview helps you track revenue trends, evaluate checkout efficiency, and identify payment issues that may affect conversion and overall performance.
Access Transaction Overview
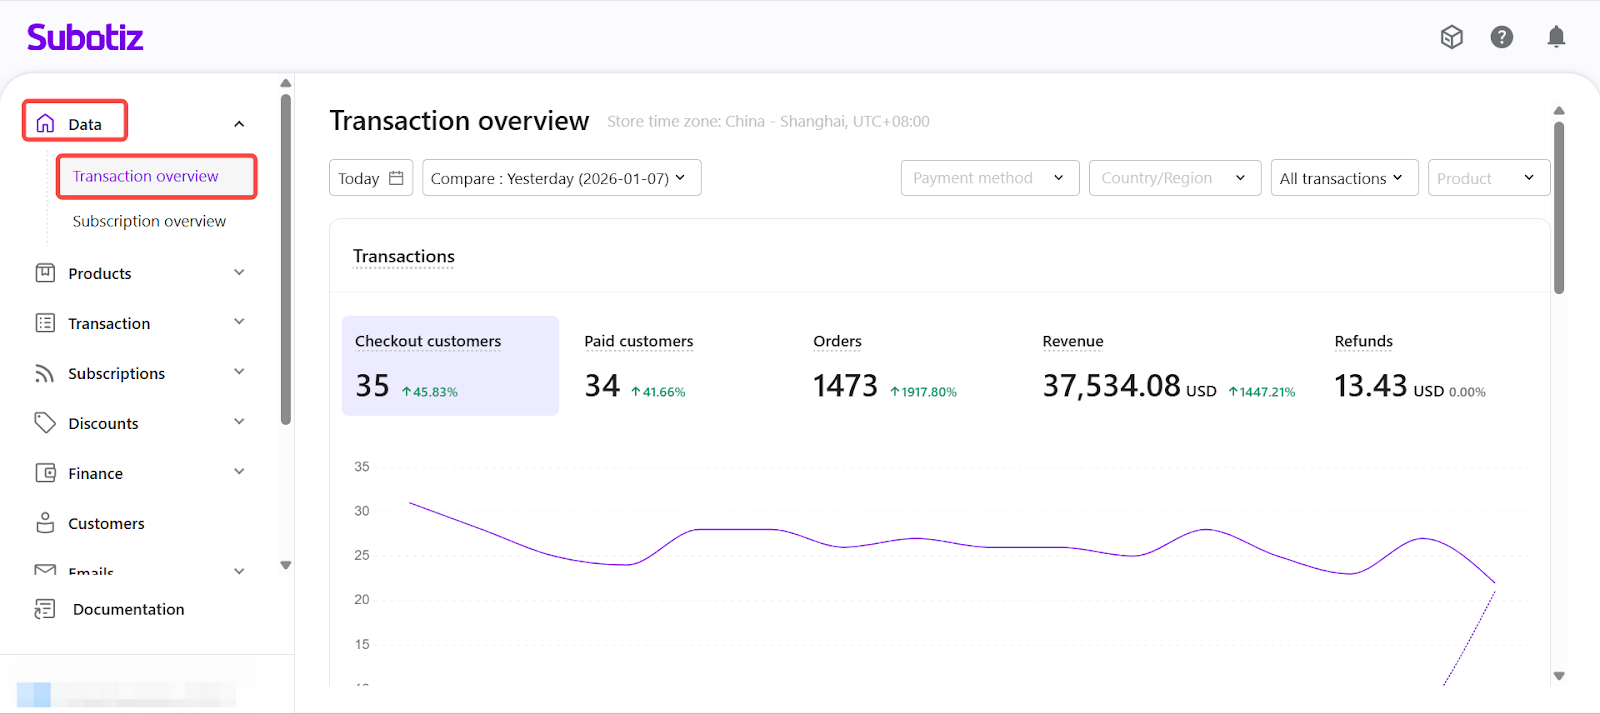
- Open Transaction Overview: From the Subotiz admin, navigate to Data > Transaction Overview to open the transaction analytics view.
Customize Your Data View with Filters
Before reviewing transaction data, use the filters at the top of the page to define the scope of your analysis. All filters apply consistently across metrics, charts, and funnel views.
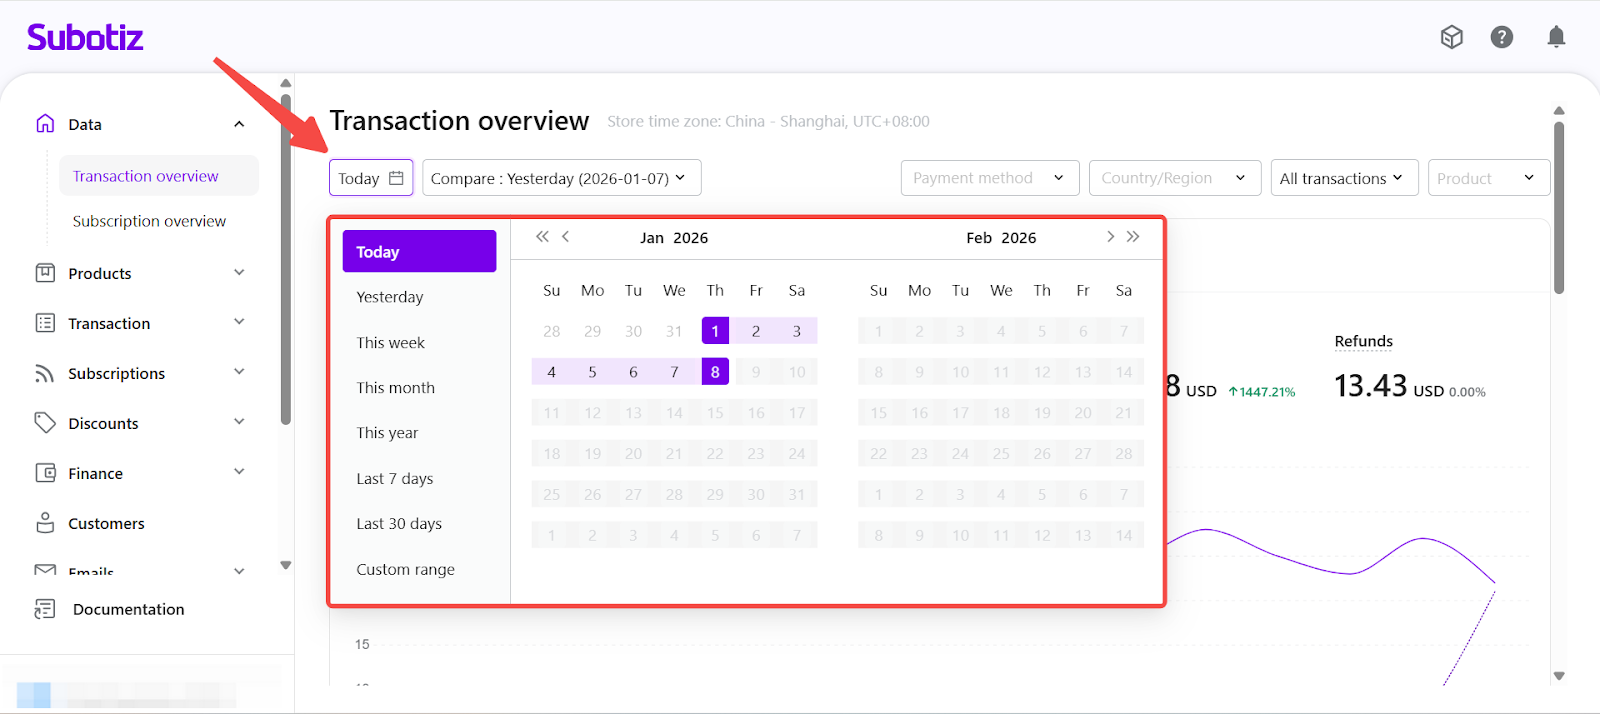
- Select a Date Range: Choose from Today, Yesterday, This Week, This Month, This Year, Last 7 Days, Last 30 Days, or a Custom Range. All metrics are calculated using your store’s time zone.
- Today: Transaction metrics update at a minute-level cadence throughout the day.
- Other periods: Data reflects completed aggregation cycles and updates on a scheduled basis. To view the most recent data, refresh the page manually.
- Compare Performance Across Periods: Enable comparison to evaluate performance against Yesterday, the same period in the previous cycle (such as last week or last month), or the same period last year.
- Increase: green text with an upward arrow ↑
- Decrease: red text with a downward arrow ↓
- No change: gray text with a flat indicator
Percentage change is calculated as:
(Current period − comparison period) ÷ comparison period × 100. Values are displayed to two decimal places.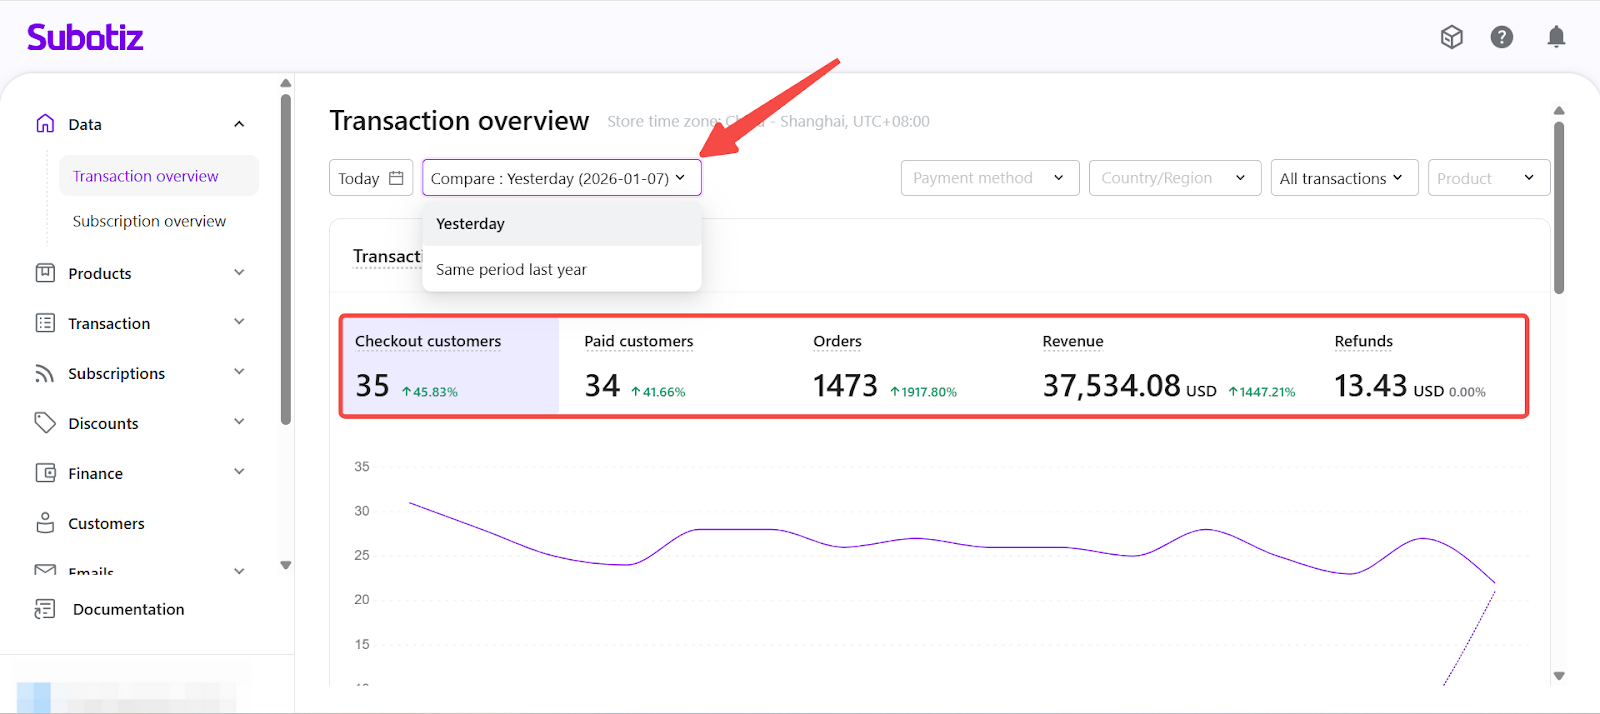
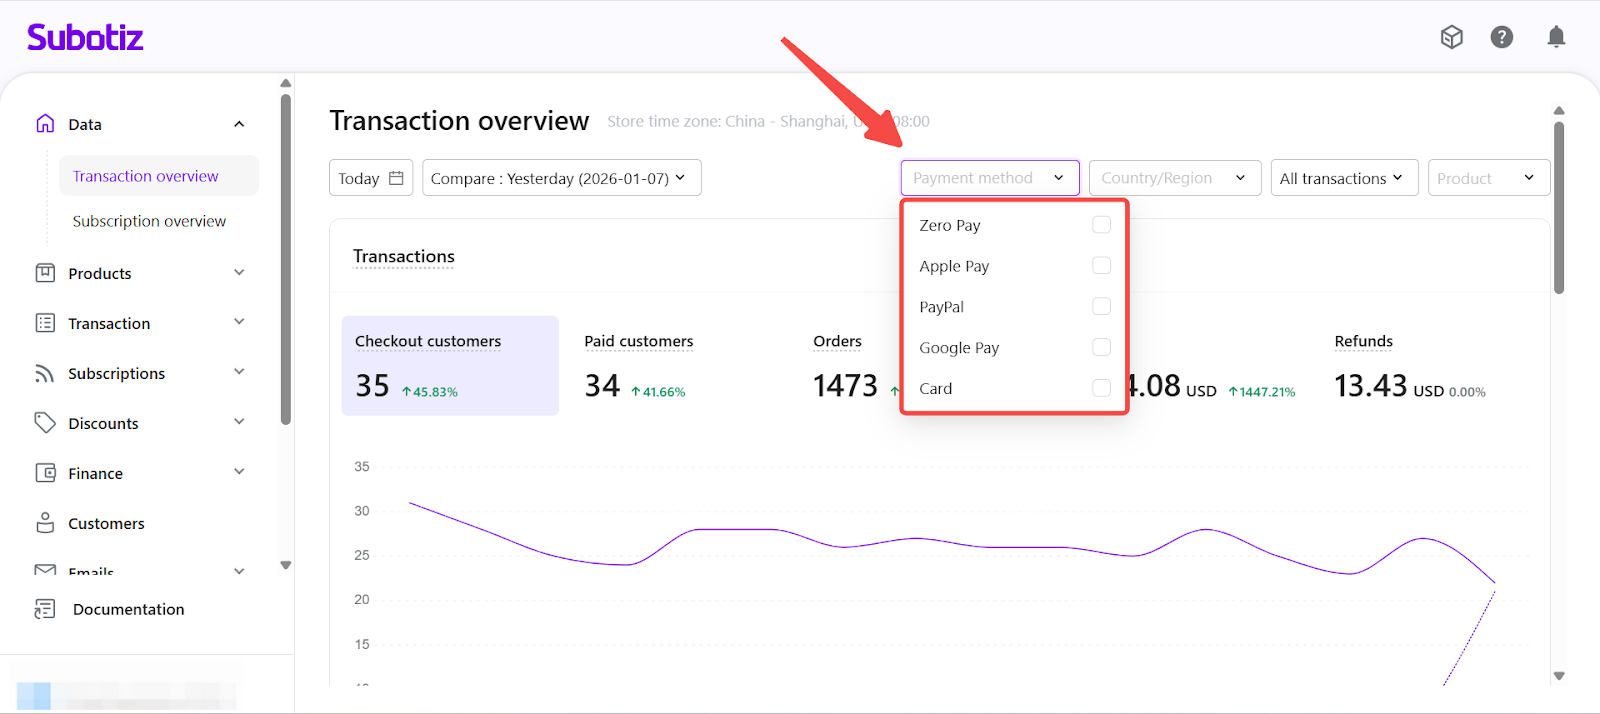
- Filter by Payment Method: Use the Payment Method dropdown to analyze transactions by specific payment options, such as Card, Apple Pay, Google Pay, PayPal, or Zero Pay. This filter helps you compare adoption, performance, and conversion behavior across different payment methods. Only transactions completed using the selected payment methods are included in the results.
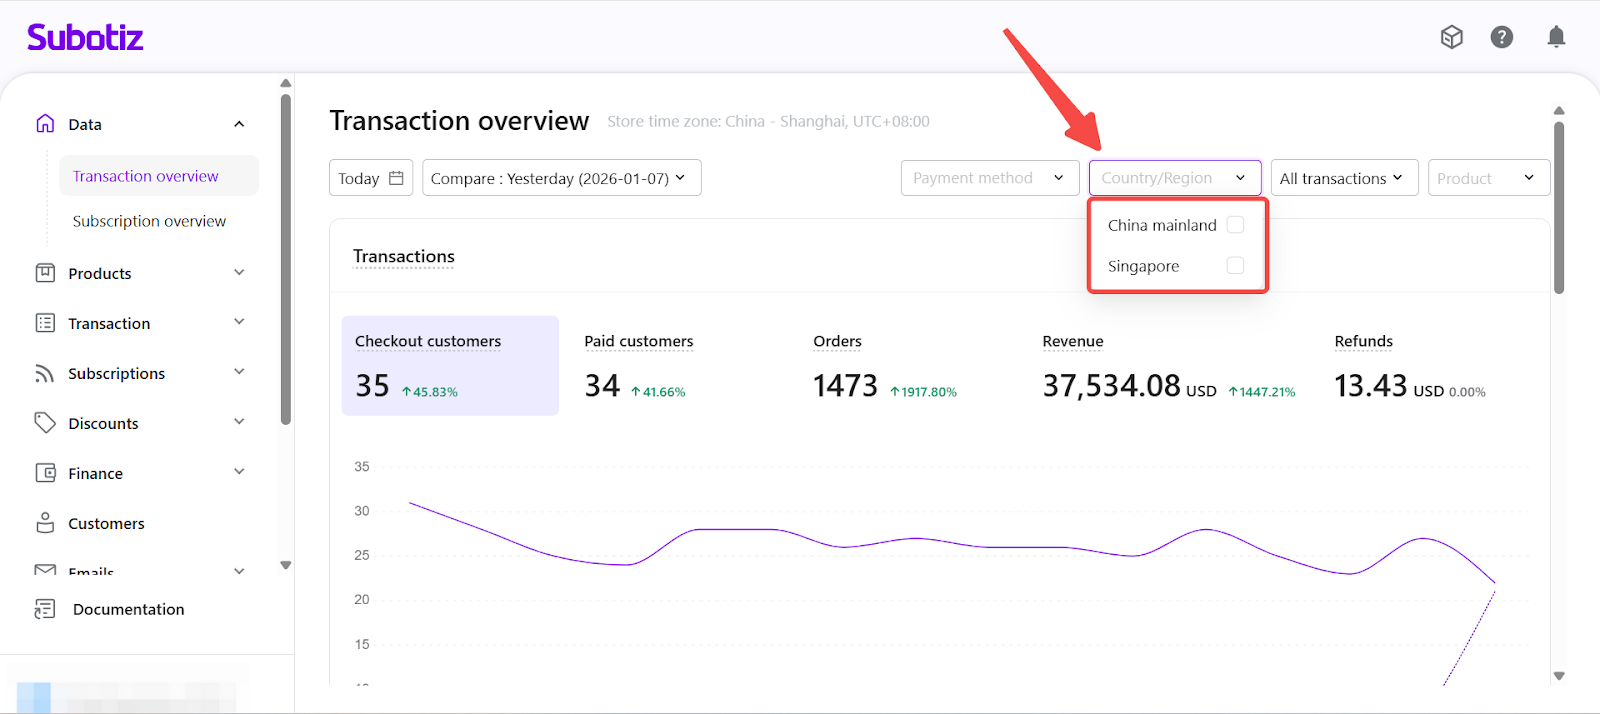
- Filter by Country or Region: Filter data by the customer’s country or region, determined by the IP address at the moment checkout is initiated. This view helps analyze regional transaction activity and payment performance.
- Filter by Transaction Type: Use the dropdown in the top-right corner to control which transactions are included in the analysis:
- All transactions
- Subscription purchases
- One-time purchases
- Subscription renewals
- Token charges
Changing the transaction type automatically updates all metrics, charts, and funnel views.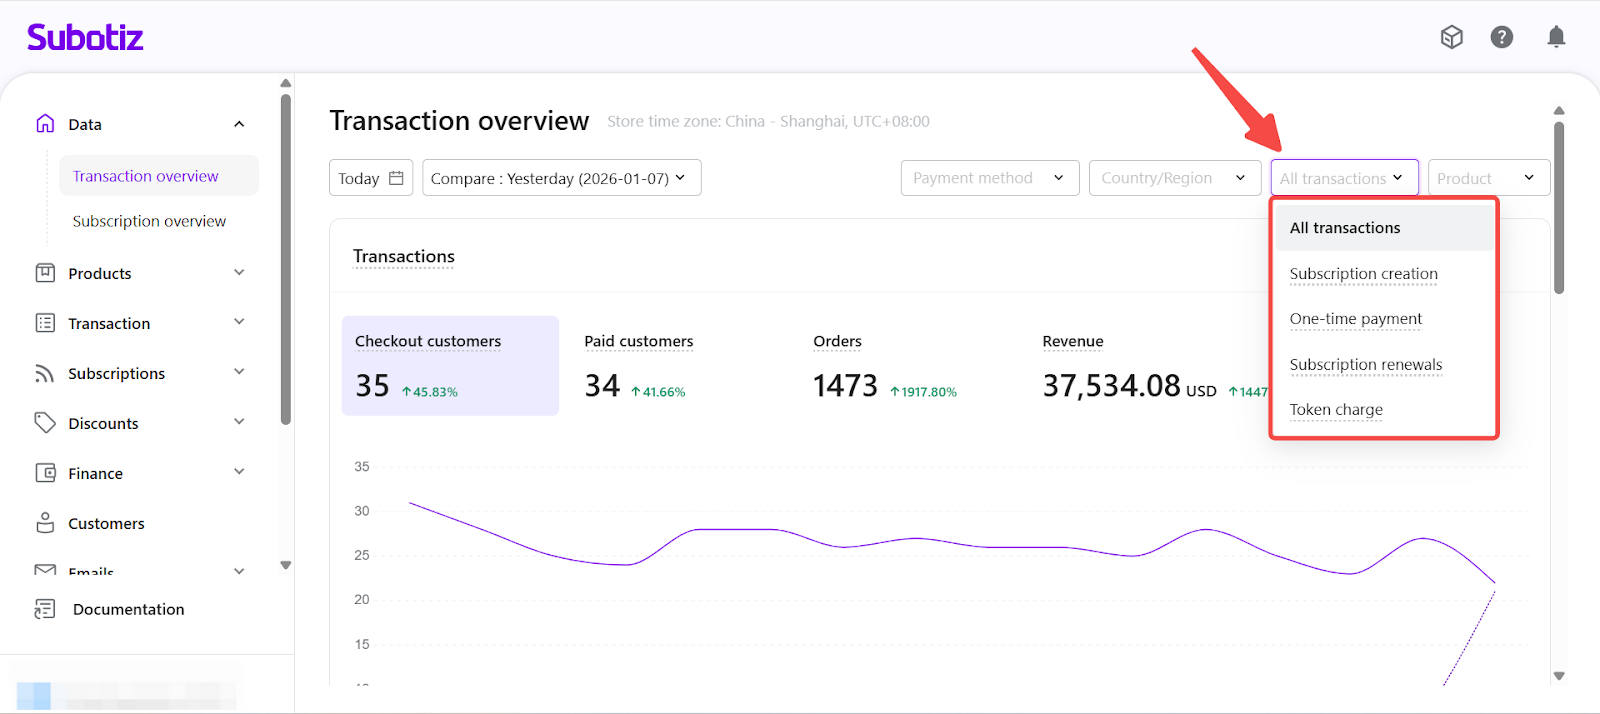
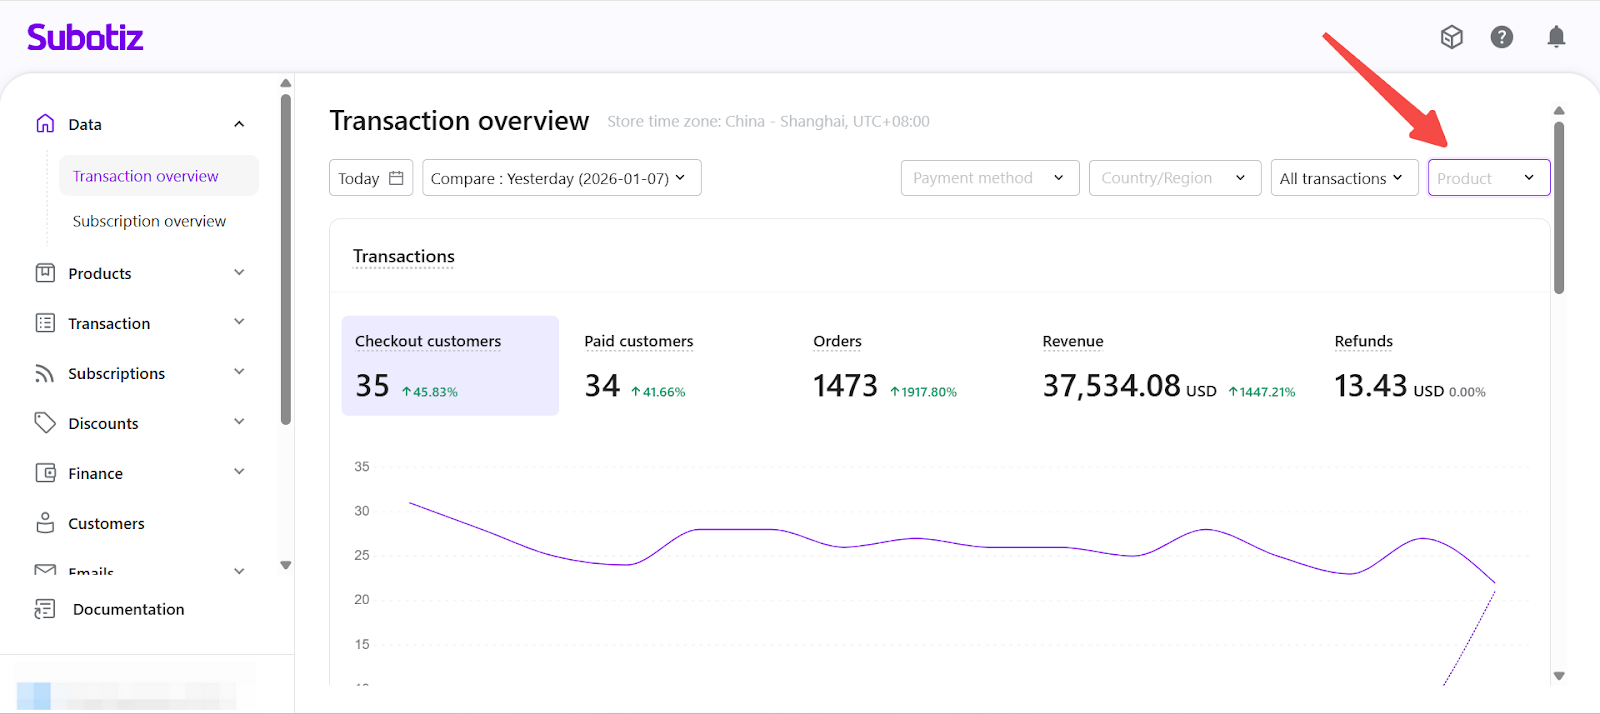
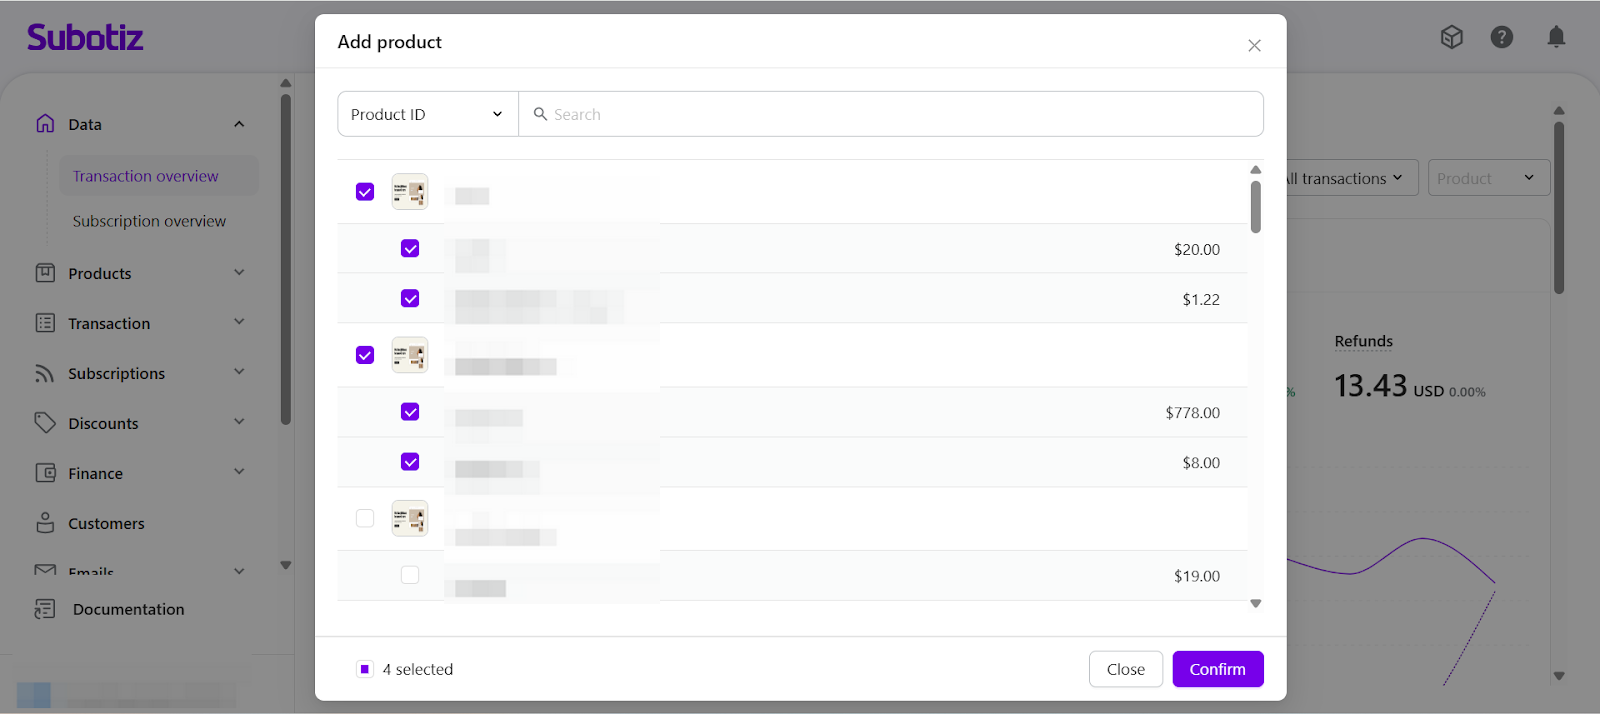
- Filter by Product: Use the Product filter to narrow analytics to one or more specific products. After selecting products from the list, Transaction Overview recalculates customer counts, orders, revenue, and conversion trends based on the selected products only. When multiple products are selected, metrics are aggregated across all selected products.
View Sales Summary Metrics
Once your filters are applied, Transaction Overview displays the following key metrics:
- Checkout customers: The number of unique customers who reached the checkout page during the selected period. Each customer is counted once per period, even if they enter checkout multiple times.
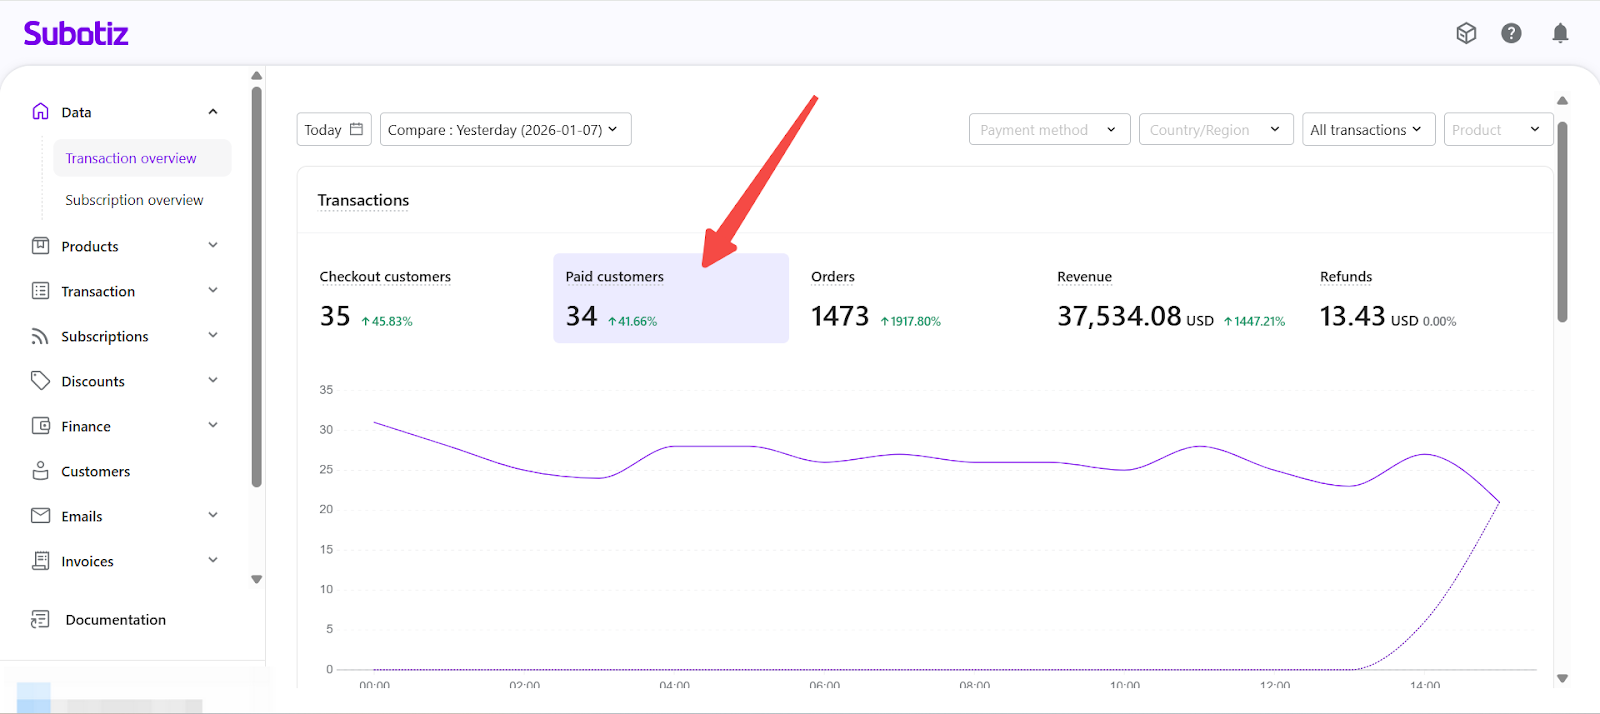
- Paid customers: The number of unique customers who successfully completed a payment during the selected period. Each customer is counted once per period, regardless of the number of successful transactions.
- Orders: Number of successfully paid orders, based on the payment success timestamp. This is the default metric selected when Transaction Overview loads.
- Revenue: The total amount of successfully paid orders during the selected period. Revenue is calculated based on the payment success timestamp and reflects only completed payments. In charts, revenue is displayed as the currency symbol and amount. In tables, it appears as currency code, symbol, and amount (for example, USD $1,000.00).
- Refunds: Total amount refunded during the selected period, based on the time refunds were successfully processed.
Additional interactions:
- Hover over each metric name to view its definition.
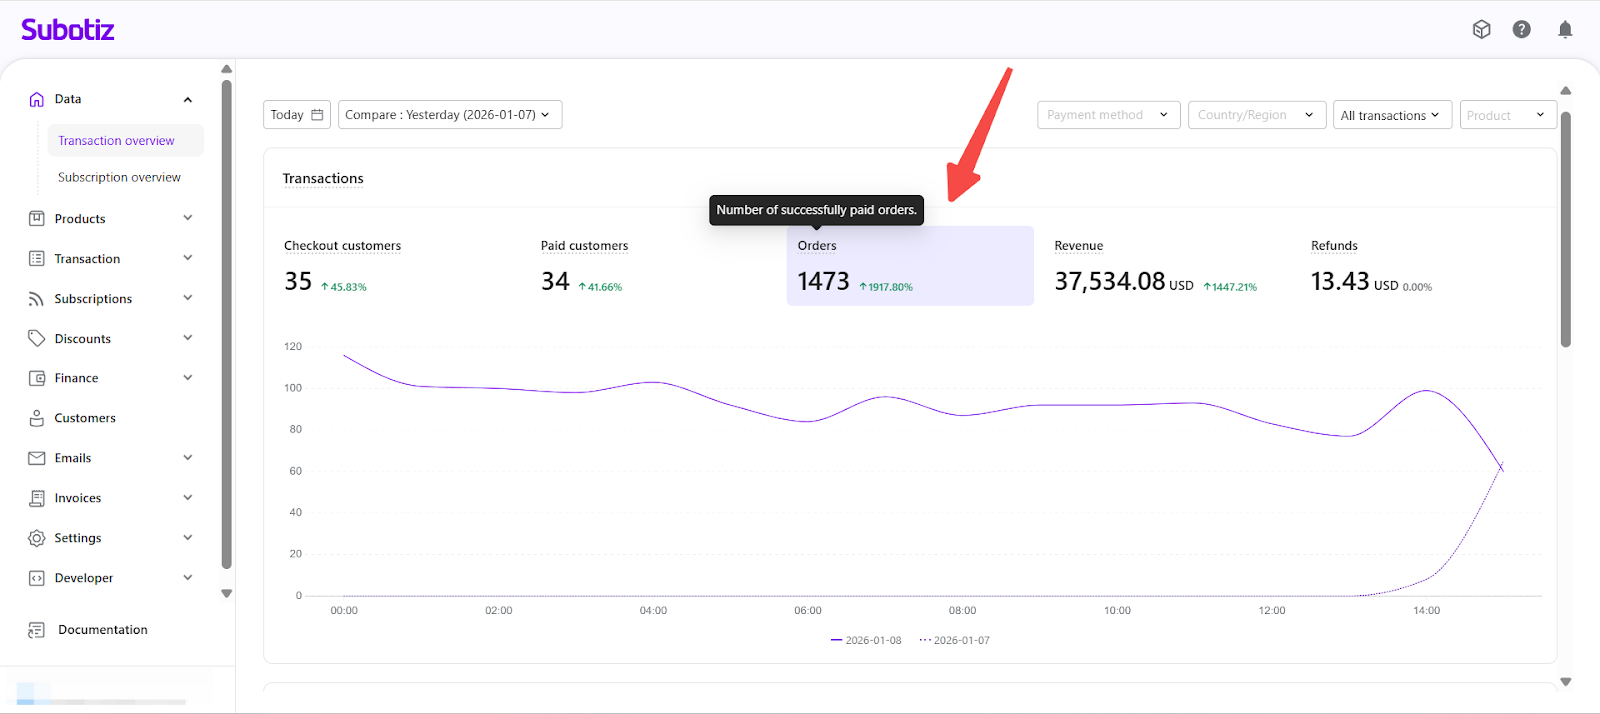
- Click a metric to update the chart below with the corresponding data.
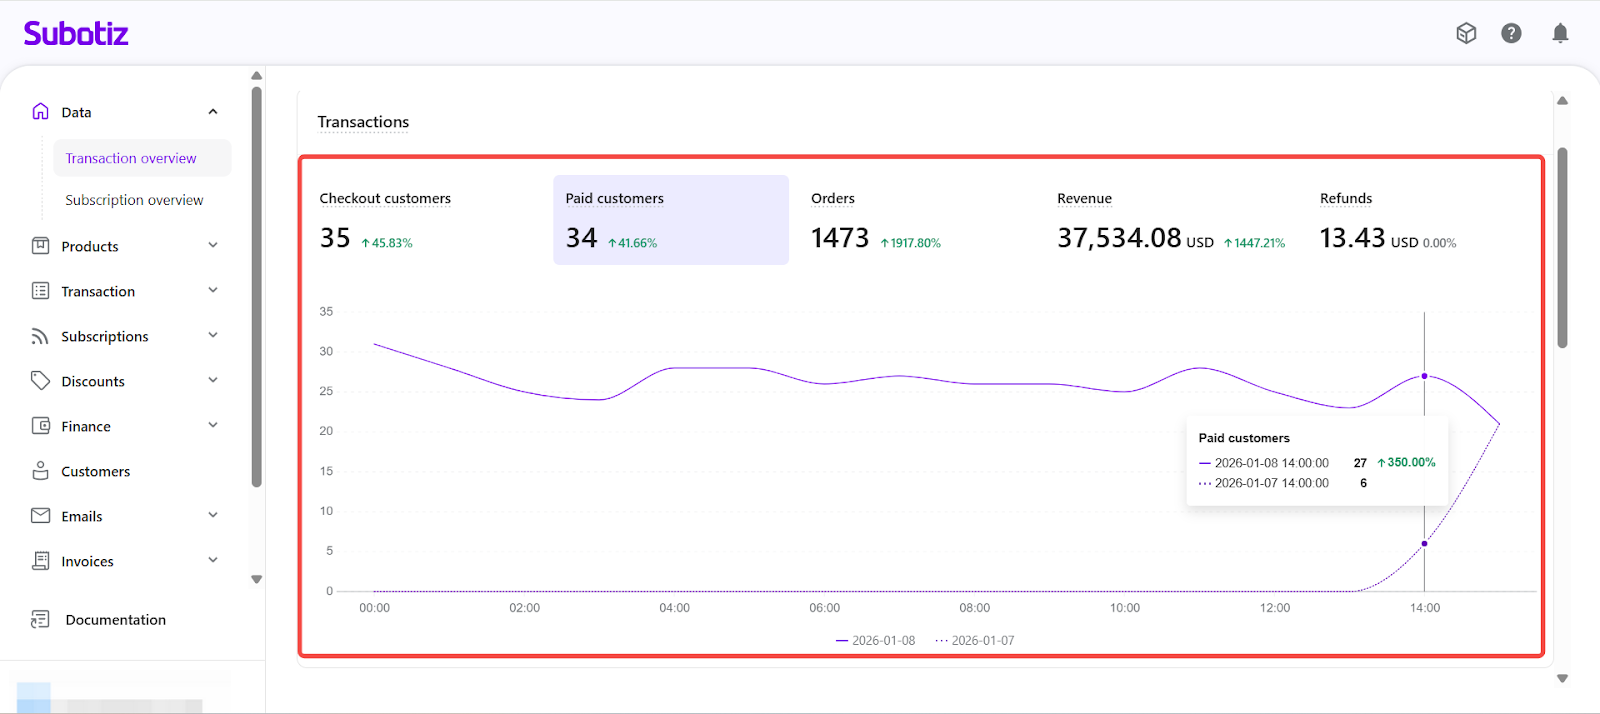
Analyze Sales Trends with the Chart
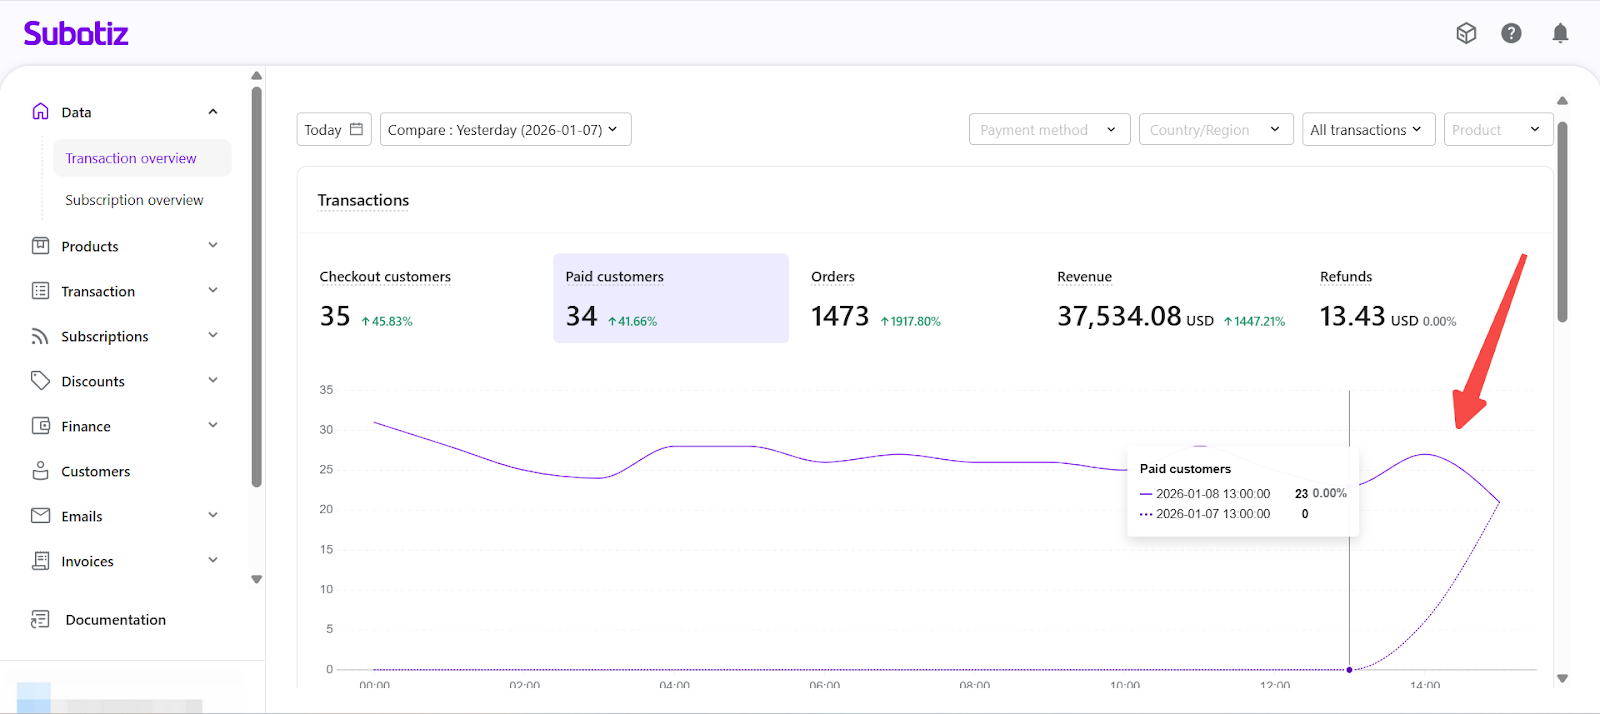
Below the summary metrics, a line chart shows how the selected metric changes over time.
- Current period is displayed as a solid line.
- Comparison period is shown as a dashed line.
- The chart automatically updates when you select a different metric.
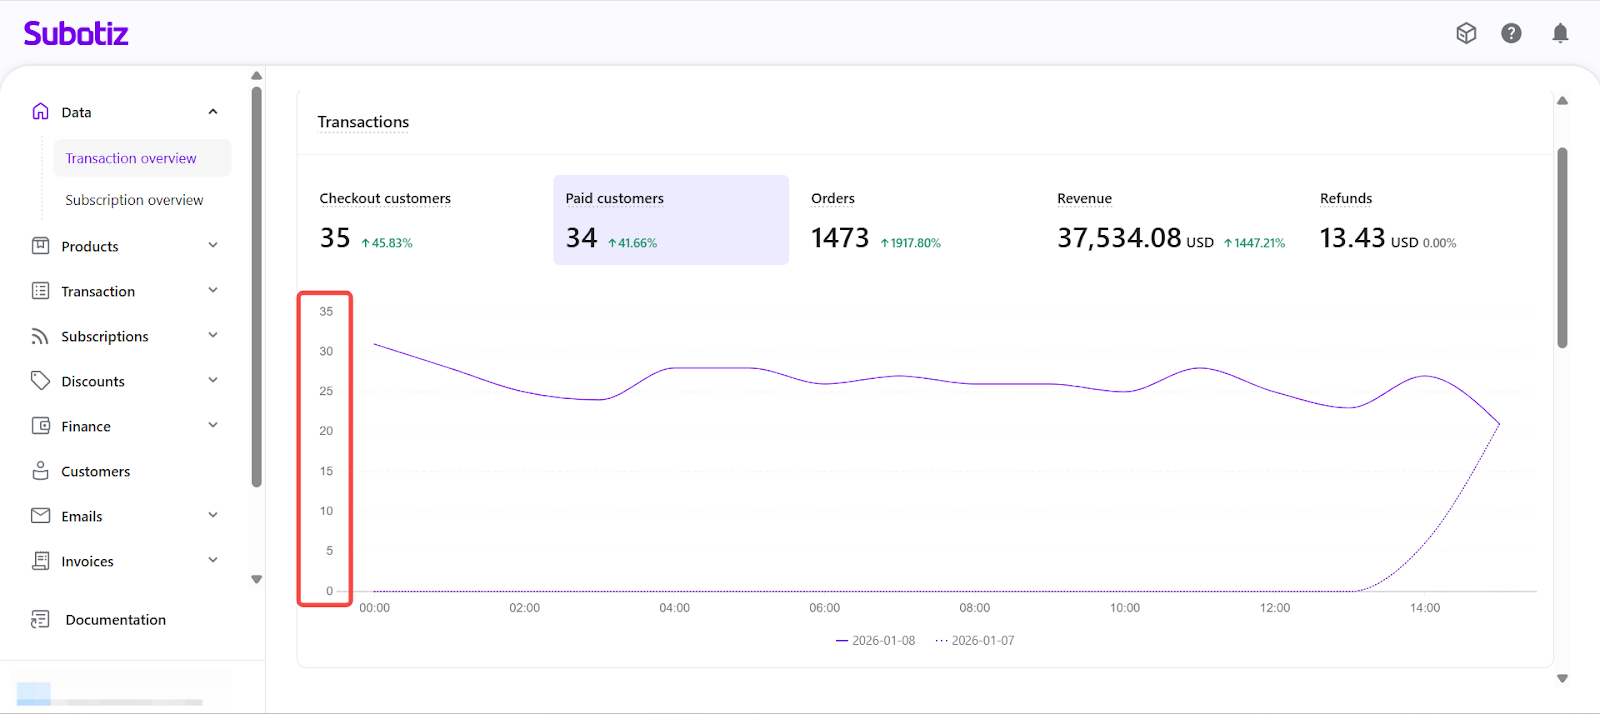
Y-axis formatting depends on the selected metric:
- For Customers and Orders: shows numeric values.
- For Amount and Refunds: shows currency symbol + amount.
X-axis format depends on the selected date range:
Range | Granularity | Format |
|---|---|---|
≤ 3 days | Hourly | Same day: HH:mm; Cross-day: MM-DD HH:mm |
> 3 days (same year) | Daily | MM-DD |
> 3 days (cross year) | Daily | YYYY-MM-DD |
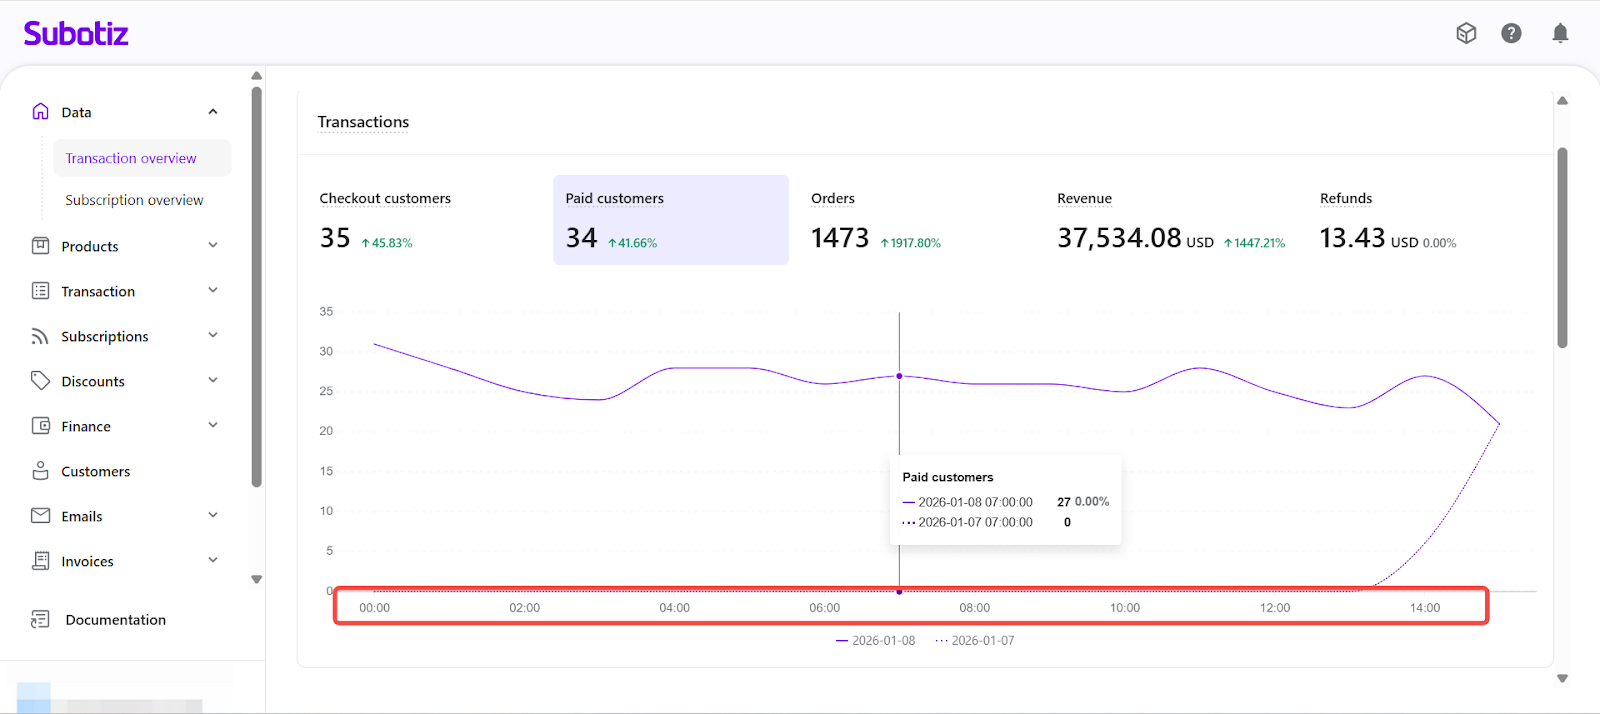
Hover behavior: When hovering over a data point, the tooltip displays both the current and comparison values, including the timestamp, metric name, and value.
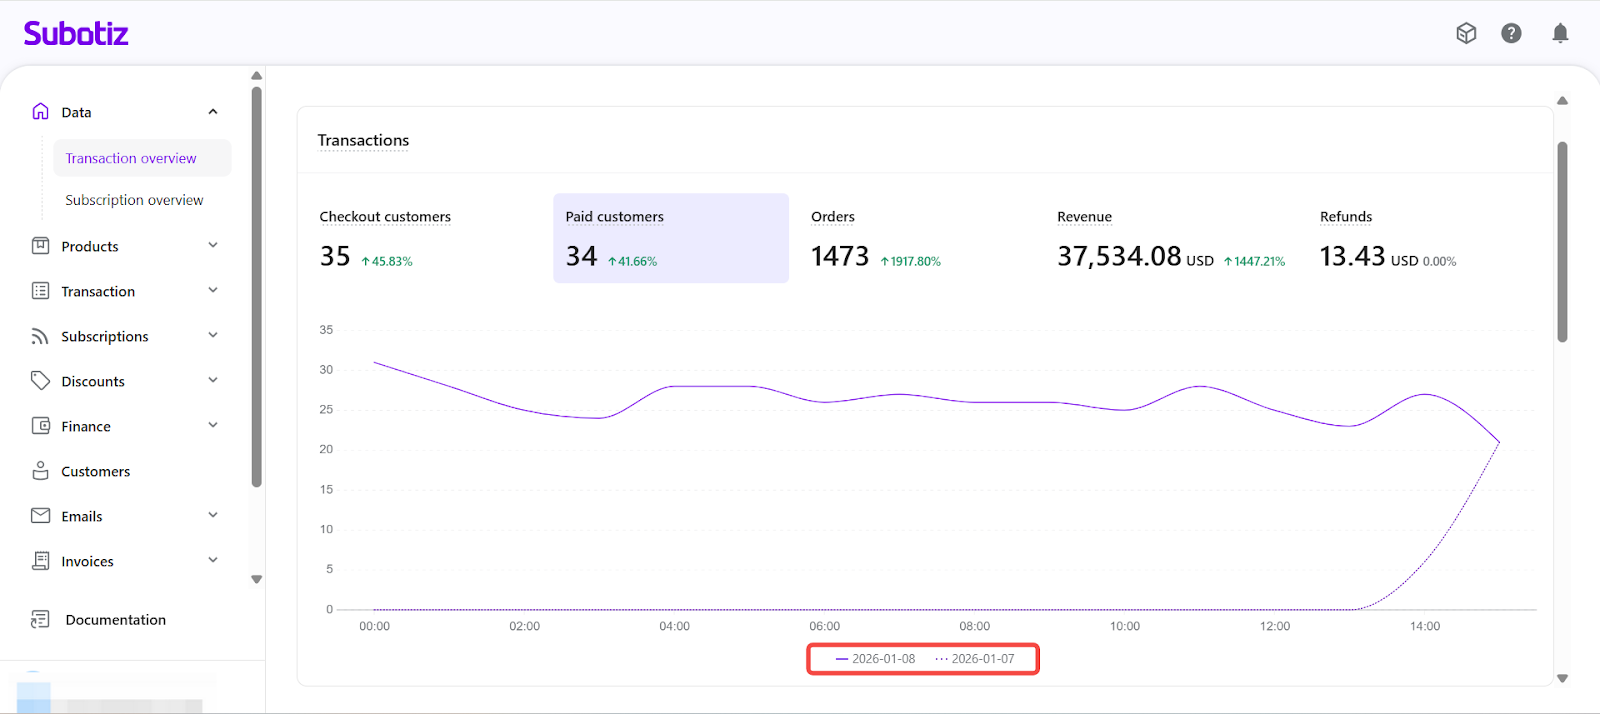
Legend behavior:
- Click to show/hide each line.
- At least one line must remain visible.
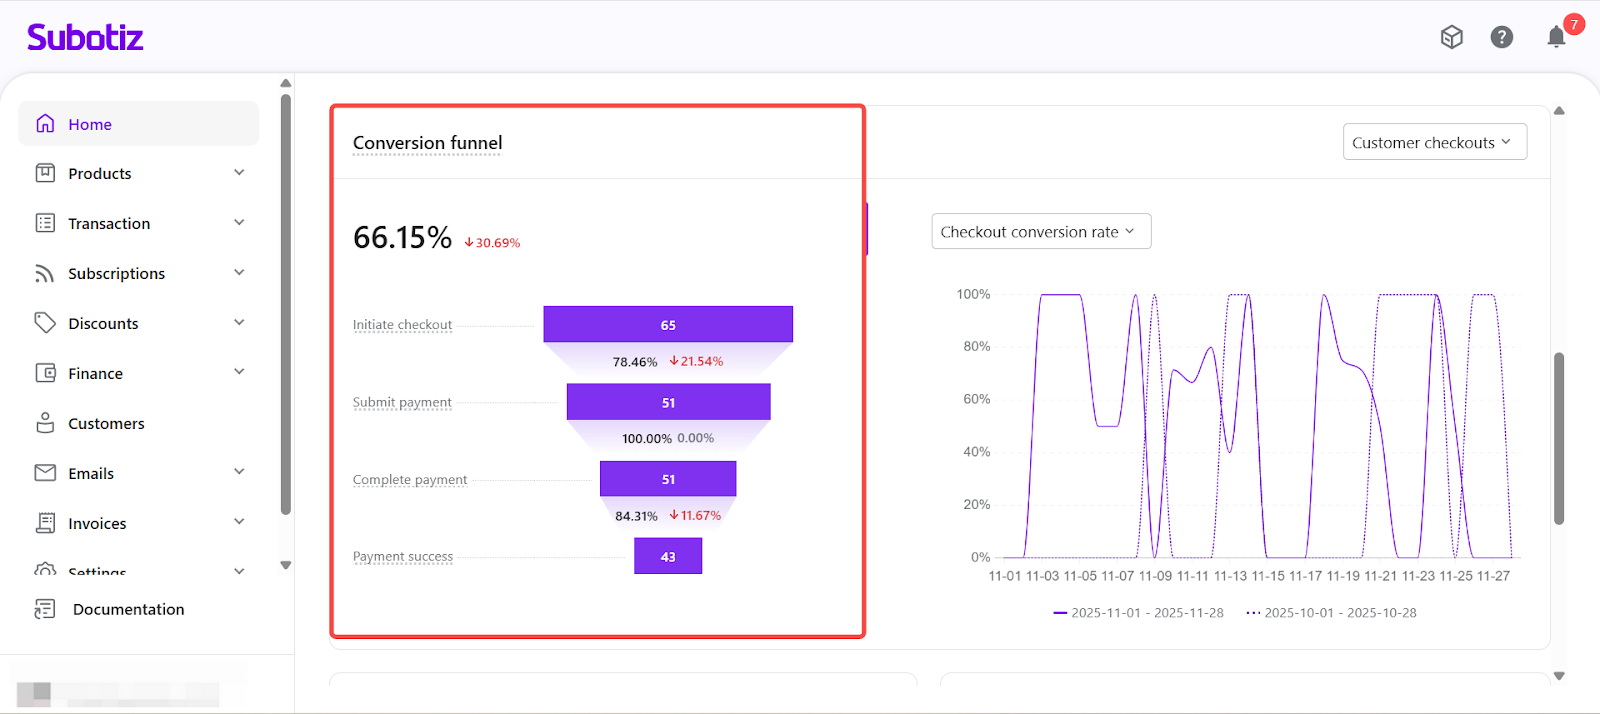
Monitor Checkout Efficiency with the Conversion Funnel
The Checkout Conversion Funnel uses a customer-based approach to show how customers progress through the payment journey. Each customer is counted once within the selected time range to ensure accurate behavior tracking.
Funnel Stages:
- Initiate Checkout: Number of customers who entered the checkout page.
- Submit Payment: Customers who submitted payment information.
- Complete Payment: Customers who completed all required payment actions (payment may still be processing).
- Payment Success: Customers with a confirmed successful payment.
Each stage shows the total count and the percentage change compared to the comparison period.
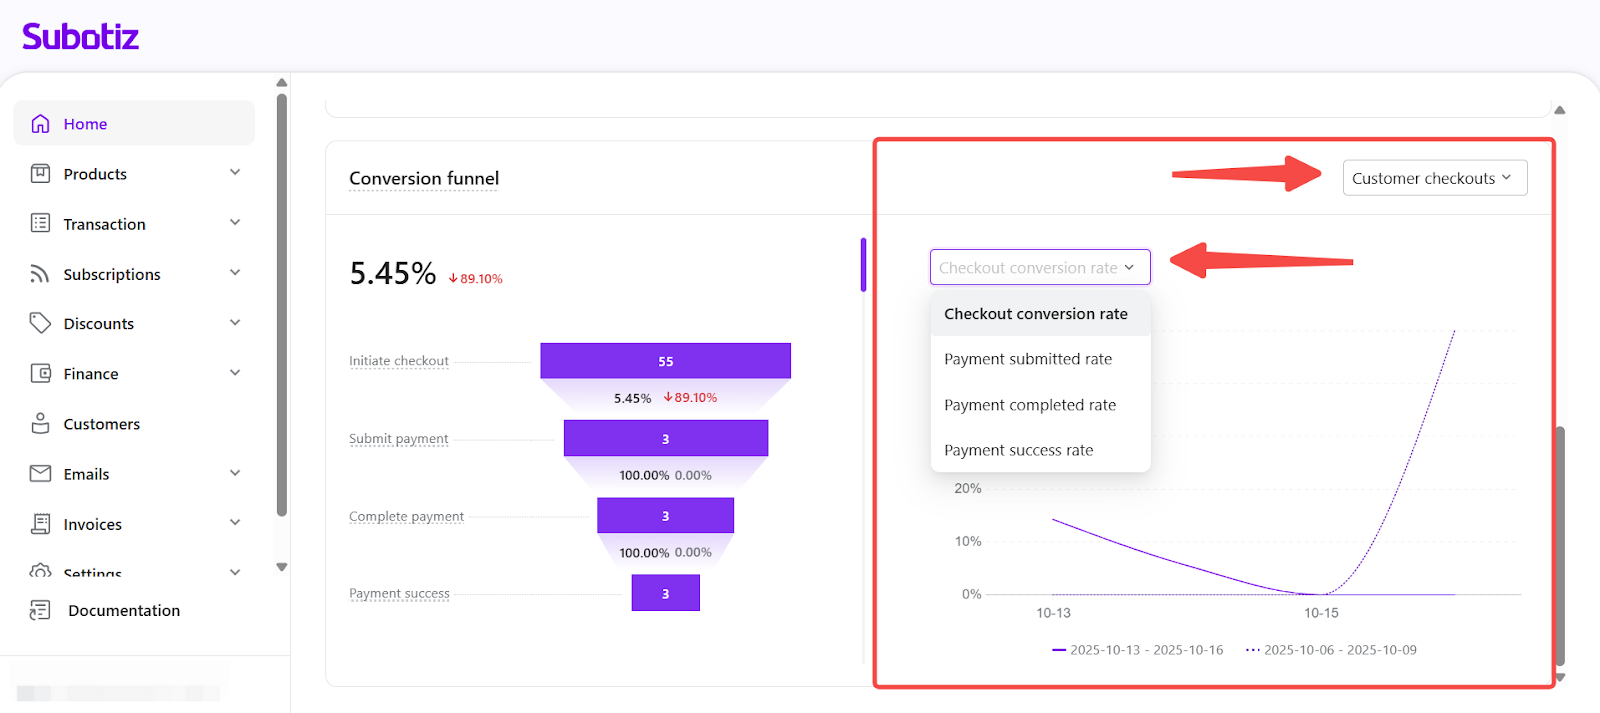
Customize Funnel Views
You can adjust the funnel display using two dropdowns:
- Metric Filter: Choose one of the following:
- Checkout Conversion Rate = Payment Success Customers ÷ Initiate Checkout Customers
- Payment Submitted Rate = Submit Payment Customers ÷ Initiate Checkout Customers
- Payment Completed Rate = Complete Payment Customers ÷ Submit Payment Customers
- Payment Success Rate = Payment Success Customers ÷ Complete Payment Customers
- Funnel Scope: Toggle between:
- Customer Checkouts
- Subscription Renewals
- Token Charges
Funnel data is updated every 15 minutes based on your store’s timezone. To see the latest results, please refresh the dashboard manually.
Use these insights to identify drop-off points and improve your checkout flow.
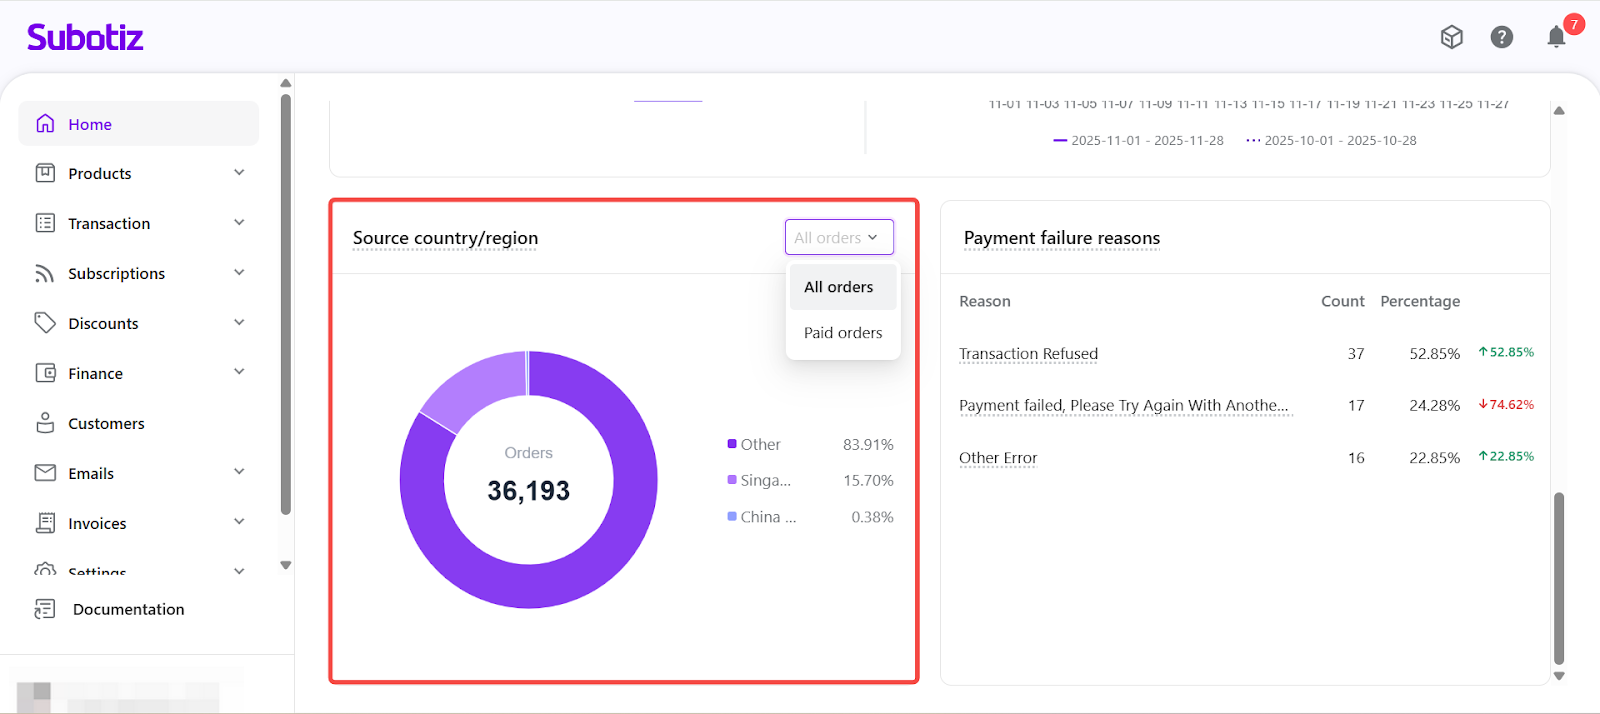
Order Source by Country/Region
Subotiz identifies the customer’s country or region using their IP address at the moment checkout is initiated. This helps evaluate market activity and purchasing intent.
You can switch between the following views:
- All Orders
- Paid Orders
Display rule: The chart displays up to the top 8 countries by order volume. Any additional countries are grouped into “Other.”
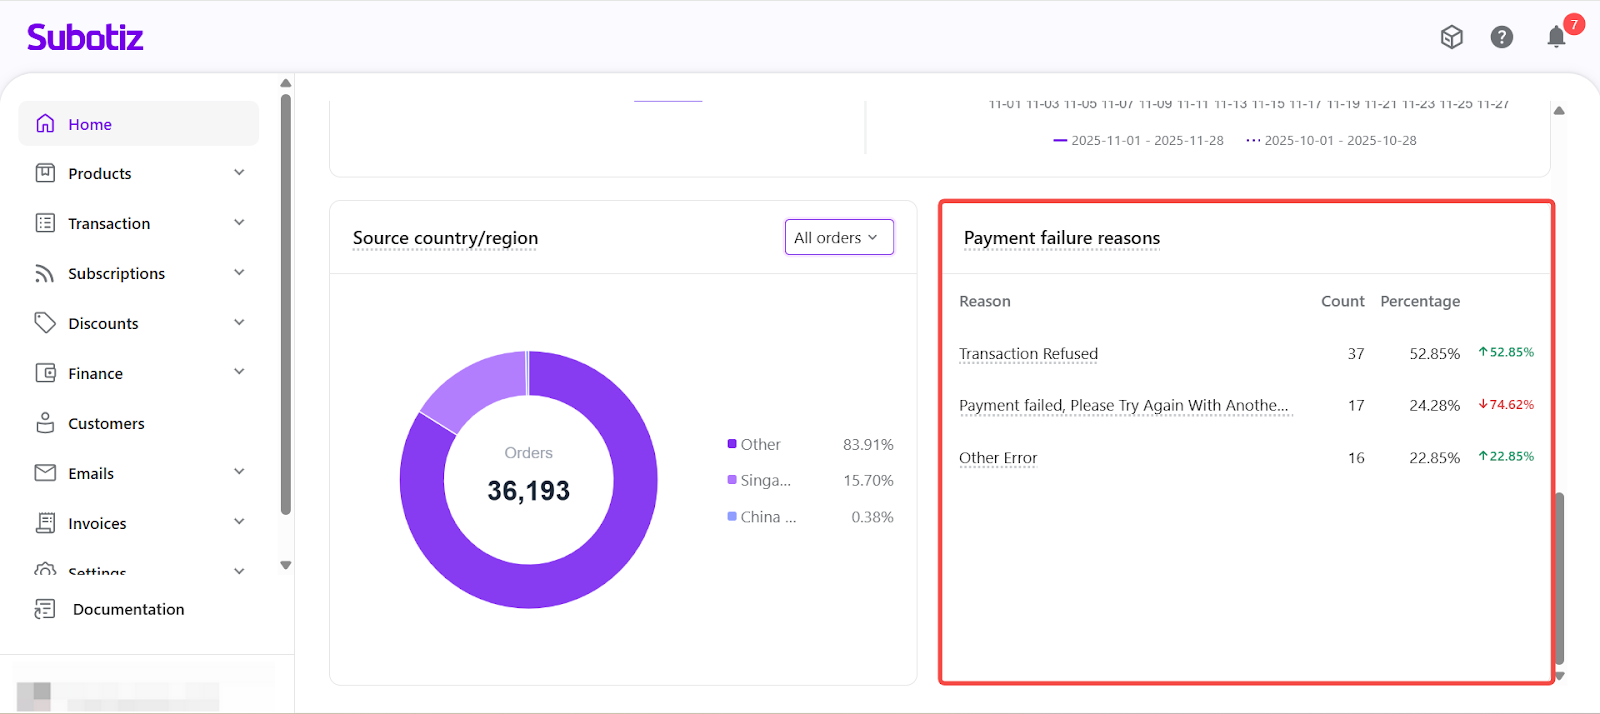
Payment Failure Reasons
This section highlights the primary reasons for failed payments and their proportions to help you troubleshoot checkout drop-offs.
Displayed information includes:
- Failure reason (e.g., Transaction Refused)
- Count
- Percentage change
If the same transaction fails multiple times during subscription renewal retries, only the final failed reason is displayed.
Transaction Overview provides a centralized view of your store’s transaction performance. Use filters and visual insights to monitor trends, identify bottlenecks, and optimize checkout performance over time.